Bitcoin Price Analysis: BTC Resumes Decline Below $50K
Bitcoin price is trading below $50,000 against the US Dollar. BTC might continue to decline as long as it is below the $50,000 pivot level.
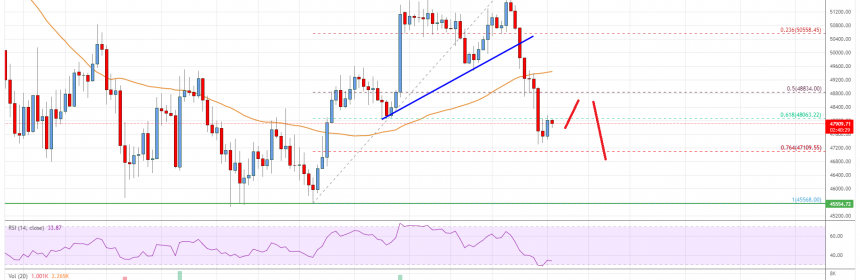
Bitcoin Price Analysis
Bitcoin price started a fresh decline from the $52,100 resistance. BTC traded below the $50,500 and $50,000 support levels to move again into a bearish zone.

There was a break below a key bullish trend line with support near $50,500 on the 4-hours chart of the BTC/USD pair. Besides, the pair declined below 50% Fib retracement level of the upward move from the $45,568 swing low to $52,100 high.
The pair is now trading below $50,000 and the 55 simple moving average (4-hours). An immediate support on the downside is near the $47,500 level.
The next key support is near the $47,200 level. It is near the 76.4% Fib retracement level of the upward move from the $45,568 swing low to $52,100 high. If the price fails to stay above $47,200, it could extend losses in the near term.
The next major support sits near $46,500, below which there is a risk of a move towards the $45,500 level. On the upside, an initial resistance is near the $48,400 level. The main resistance is forming near the $49,600 zone and the 55 SMA.
A close above the $49,600 zone is needed for a fresh increase. In the stated case, the price is likely to rise steadily and might even surpass the $50,000 level. The next major resistance on the upside is near the $52,000 level.

Bitcoin Price
Looking at the chart, bitcoin price is clearly trading below $50,000 and the 55 simple moving average (4-hours). Overall, the price could decline heavily if there is a clear move below the $47,100 support zone.
Technical indicators
4 hours MACD – The MACD is now gaining momentum in the bearish zone.
4 hours RSI (Relative Strength Index) – The RSI is now below the 50 level.
Key Support Levels – $47,200 and $45,500.
Key Resistance Levels – $48,400, $49,600 and $52,000.
Source: Read Full Article