Bitcoin Cash is Stuck in a Range as Bears Threaten to Short

Today, the price of Bitcoin Cash (BCH) is falling after being pushed back from the $600 resistance level. The market is expected to fall back to the low of $540 and rise later.
However, if the price falls below the 21-day line SMA, selling pressure will extend to the $480 low. Bitcoin Cash will start another round of downward correction if buyers lose the $540 support level.

Meanwhile, the altcoin is trading below the 50-day line SMA but above the 21-day line SMA. The market will reverse the trend once the moving averages are broken. A break above the 50-day line SMA will signal the resumption of the uptrend. Likewise, a break below the 21-day line SMA will cause the altcoin to fall further. At the time of writing, BCH is trapped between the moving averages.
Bitcoin Cash indicator reading
The cryptocurrency is at the 49 level of the Relative Strength Index for period 14, indicating that BCH is below the 50 midline, but there is a balance between supply and demand. BCH has a bearish crossover as the 21-day line SMA falls below the 50-day line SMA. Also, crypto is below the 80% area of the daily stochastic. The market has resumed its bearish momentum.
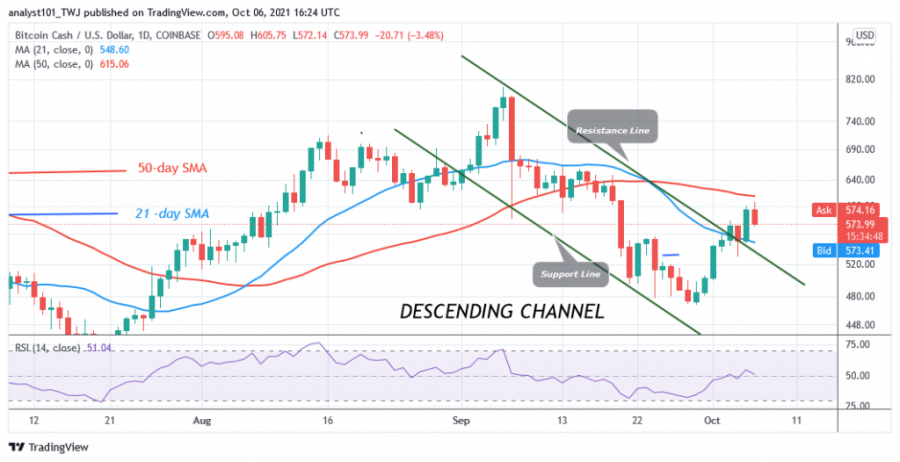
Key Resistance Zones: $800, $820, $840
Key Support Zones: $500, $480, $460
What is the next move for Bitcoin Cash?
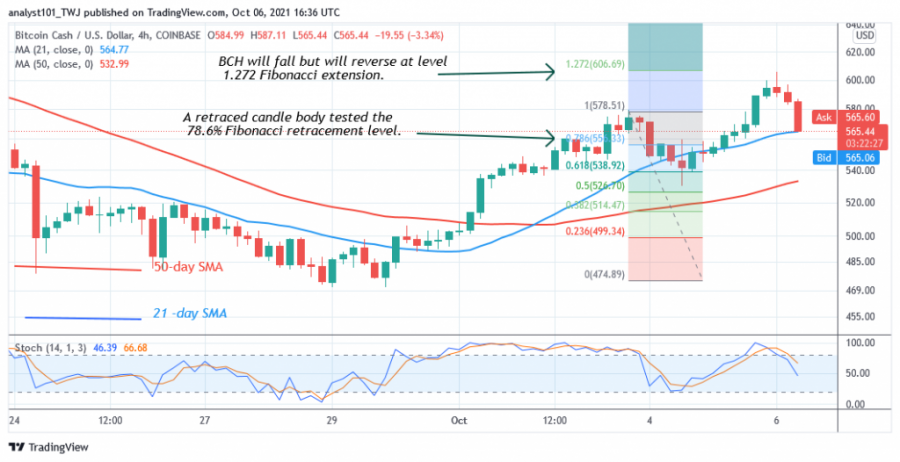
BCH/USD is on a downward move after testing resistance at $600. The price has hinted at a possible move for the altcoin. Meanwhile, the uptrend from October 3 has tested the 78.6% Fibonacci retracement level. The retracement suggests that BCH is likely to rise but will reach a reversal point at the Fibonacci extension of 1.272 Fibonacci extension or at $607.01.
Disclaimer. This analysis and forecast are the personal opinions of the author and are not a recommendation to buy or sell cryptocurrency and should not be viewed as an endorsement by Coin Idol. Readers should do their own research before investing funds.
Source: Read Full Article