Bitcoin Cash Analysis: Can Bulls Overcome Selling Pressure?
Bitcoin cash price is struggling to move higher above $475 against the US Dollar, similar to bitcoin. BCH/USD must stay above $445 and $430 to start a fresh increase.
Bitcoin Cash Price Analysis
After struggling to stay above the $500 level, bitcoin cash price started a fresh decline. BCH broke the $475 and $470 support levels to move into a bearish zone.

There was a clear downside break below the $465 and $450 support levels. The pair tested the $445 level and recently formed a support base. The recent low was formed near $443 and the price is now consolidating losses.
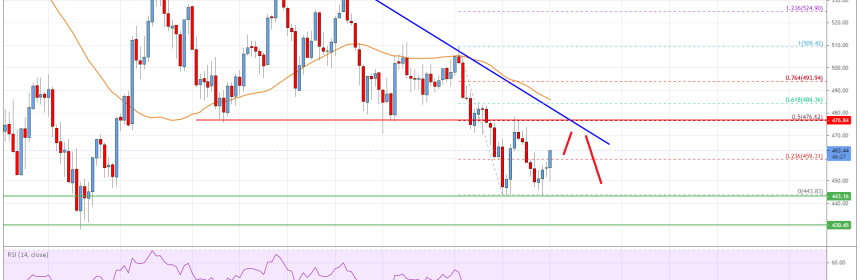
It broke the 23.6% Fib retracement level of the recent decline from the $509 swing high to $443 low. An initial resistance is near the $470 level. The first major resistance is near the $475 level. There is also a key bearish trend line forming with resistance near $472 on the 4-hours chart of the BCH/USD pair.
The trend line is close to the 50% Fib retracement level of the recent decline from the $509 swing high to $443 low. To move into a positive zone, the price must break $475. The next major resistance is near the $500 level.
An immediate support on the downside is near the $445 level. A downside break below the $445 support zone could open the doors for a larger decline. The next major support is near the $430 level, below which the price may even test $400.

Bitcoin Cash Price
Looking at the chart, bitcoin cash price is showing bearish signs below $475 and the 55 simple moving average (4-hours). Overall, the price could start a decent increase if it clears the $472 and $475 resistance levels.
Technical indicators
4 hours MACD – The MACD for BCH/USD is now gaining pace in the bullish zone.
4 hours RSI (Relative Strength Index) – The RSI for BCH/USD is near the 45 level.
Key Support Levels – $445 and $430.
Key Resistance Levels – $475 and $500.
Source: Read Full Article