TA: Bitcoin Topside Bias Vulnerable, Why BTC Could Dive Below $35K

Bitcoin price is facing a couple of strong hurdles near $36,750 and $37,800 against the US Dollar. BTC could decline heavily if it breaks the $34,800 support zone.
- Bitcoin is struggling to gain bullish momentum above the $36,750 and $38,000 resistance levels.
- The price is now trading well below $38,000 and the 100 hourly simple moving average.
- There is a major bearish trend line forming with resistance near $36,400 on the hourly chart of the BTC/USD pair (data feed from Kraken).
- The pair is likely to accelerate lower if it fails to stay above the $34,800 support zone.
Bitcoin Price Showing a few Bearish Signs
After a failed attempt to settle above $38,000, bitcoin price started another decline. BTC broke the $36,400 and $35,500 support levels to move into a short-term bearish zone.

The price even spiked below $34,500 and settled below the 100 hourly simple moving average. A low was formed near $33,930 before the price started a decent upward move. It climbed above $35,500, but it seems to be facing a strong resistance near $36,750.
A high is formed near $36,888 and the price is currently showing a few bearish signs. It already traded below the 23.6% Fib retracement level of the recent wave from the $33,930 low to $36,888 high.
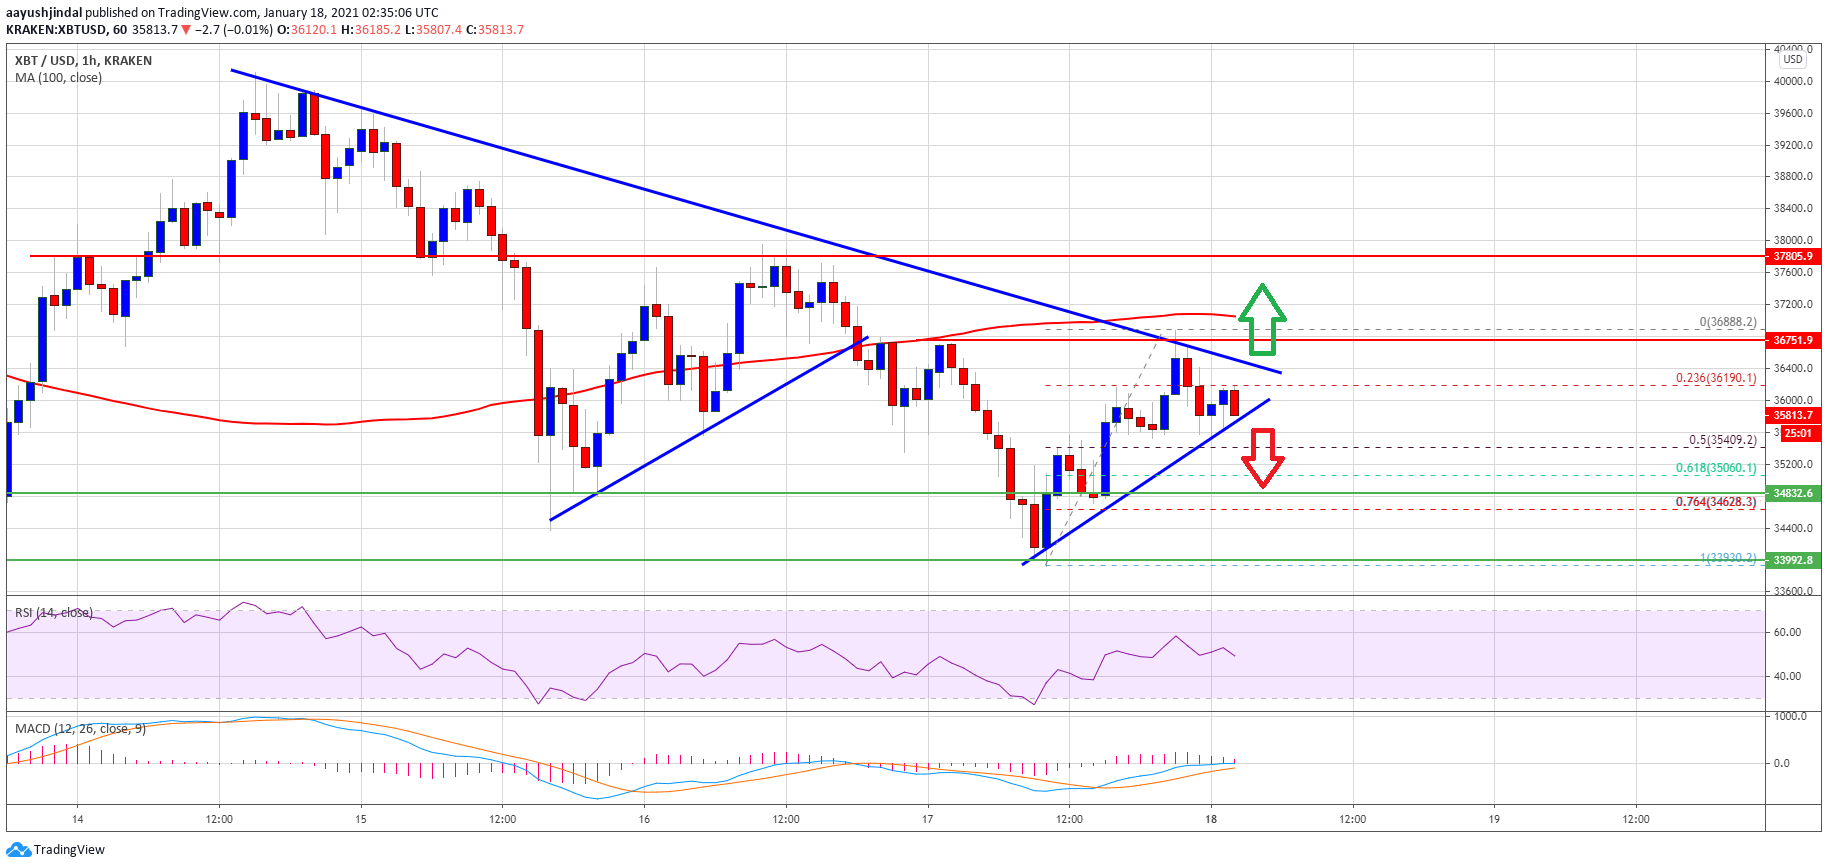
Source: BTCUSD on TradingView.com
There is also a major bearish trend line forming with resistance near $36,400 on the hourly chart of the BTC/USD pair. On the downside, an initial support is near the $35,800 level and a connecting bullish trend line. A clear break below $35,800 might call for a test of $35,400.
The 50% Fib retracement level of the recent wave from the $33,930 low to $36,888 high is at $35,400 to provide support. Any more losses could accelerate the decline and bitcoin price might dive below $35,000 and $34,500. In the stated case, there is a risk of a break below the $34,000 support zone.
Chances of an Upside Break in BTC
If bitcoin stays above the $35,800 and $35,400 support levels, there are chances of an upside break. The first major resistance is near the $36,750 level.
The main resistance is now forming near the $37,800 and $38,000 levels. A close above the $38,000 level is must to start a strong increase towards $40,000 or even higher in the near term.
Technical indicators:
Hourly MACD – The MACD is slowly losing momentum in the bullish zone.
Hourly RSI (Relative Strength Index) – The RSI for BTC/USD is struggling to stay above the 50 level.
Major Support Levels – $35,400, followed by $34,000.
Major Resistance Levels – $36,750, $37,800 and $38,000.
Source: Read Full Article