TA: Bitcoin Takes Back Seat After Massive Rally, Why BTC Could Restart Surge

Bitcoin price surged above $32,000 and traded to a new all-time high near $34,780 against the US Dollar. BTC is currently correcting lower and it might even test $31,500.
- Bitcoin is showing a lot of positive signs above the $30,000 and $31,500 levels.
- The price is correcting gains, but it remains well supported above $31,500 and the 100 hourly simple moving average.
- There is a major bullish trend line forming with support near $31,000 on the hourly chart of the BTC/USD pair (data feed from Kraken).
- The pair could start an extended downside correction if it breaks the $32,500 support zone.
Bitcoin Price Correcting Gains
There was a sharp increase in bitcoin price above the $32,500 resistance zone. BTC broke the $33,500 and $34,000 levels to continue higher. The bulls even attempted a test of the $35,000 level.

A new all-time high was formed near $34,780 before the price started a downside correction. There was a break below the $33,500 and $33,000 levels. The price tested the $32,500 zone, where it found a strong support.
Bitcoin started consolidating in a range above the $32,500 zone. It climbed above the $33,000 level. There was a break above the 50% Fib retracement level of the downside correction from the $34,780 swing high to $32,333 swing low.
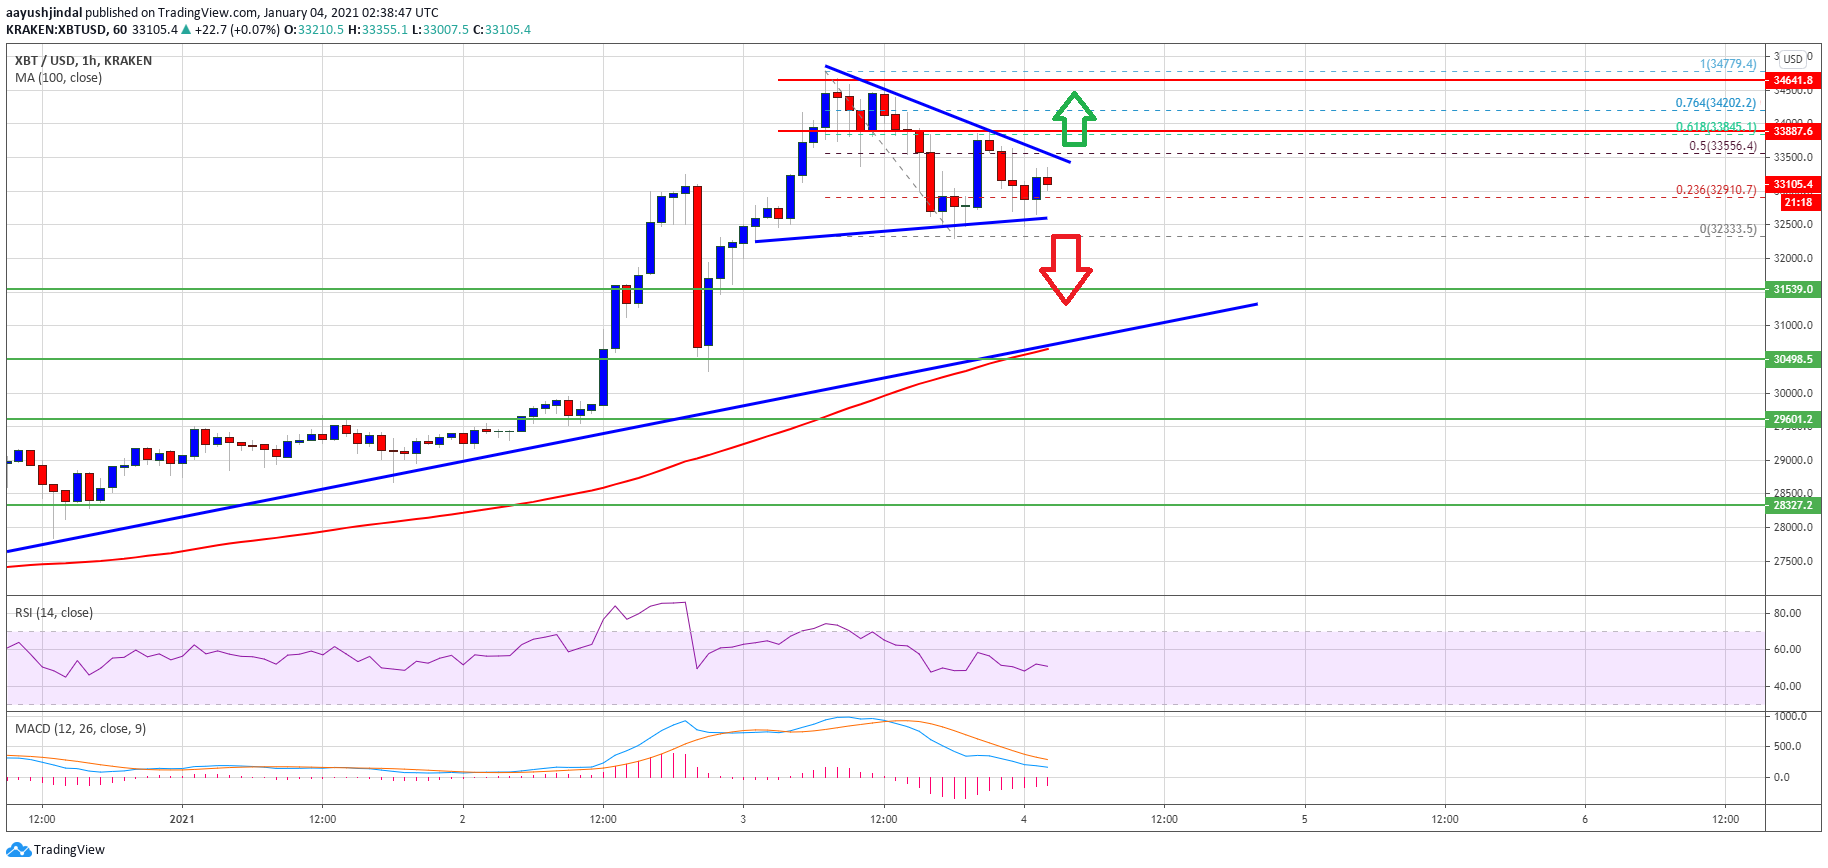
Source: BTCUSD on TradingView.com
However, the price failed to clear the $33,800 resistance zone. It seems like it failed near the 61.8% Fib retracement level of the downside correction from the $34,780 swing high to $32,333 swing low.
It is now trading in a contracting triangle with resistance near the $33,550 zone on the hourly chart. A clear break above the $33,550 and $33,800 levels could open the doors for a fresh increase. A close above the $34,000 may further increase the chances of a push towards $35,000 and $35,500 in the near term.
Dips Supported in BTC?
If bitcoin fails to clear the $33,500 and $33,800 levels, it could break the triangle support and continue lower. The next major support is near the $31,500 level.
There is also a major bullish trend line forming with support near $31,000 on the same chart. Any more losses could lead the price towards the $30,000 level and the 100 hourly SMA.
Technical indicators:
Hourly MACD – The MACD is gaining momentum in the bullish zone.
Hourly RSI (Relative Strength Index) – The RSI for BTC/USD is close to the 50 level.
Major Support Levels – $32,500, followed by $31,500.
Major Resistance Levels – $33,550, $34,000 and $35,000.
Source: Read Full Article