TA: Bitcoin Nosedives To $28.5K, Why Important Support Turned Resistance

Bitcoin price is down over 15% and it broke many supports near $32,000 against the US Dollar. BTC even traded close to $28.5K and it is currently correcting losses.
- Bitcoin started a strong decline below the $33,000 and $32,000 support levels.
- The price is currently correcting losses, but it is now well below $32,000 and the 100 hourly simple moving average.
- There is a key bearish trend line forming with resistance near $32,700 on the hourly chart of the BTC/USD pair (data feed from Kraken).
- The pair is likely to face a strong selling interest near the $32,000 and $32,800 levels.
Bitcoin Price Turns Red
Yesterday, we discussed the chances of more losses in bitcoin price below $33,000. BTC failed to recover above $34,500 and it started a strong decline. There was a break below many important supports near $33,000 and $32,800.

It opened the doors for more downsides below $32,000 and the price settled well below the 100 hourly simple moving average. The price even tumbled below the $30,000 level. It traded close to the $28,500 support and it is currently correcting losses.
There was a break above the $30,000 level. Bitcoin price is now trading above the 23.6% Fib retracement level of the recent decline from the $32,707 high to $28,808 low.
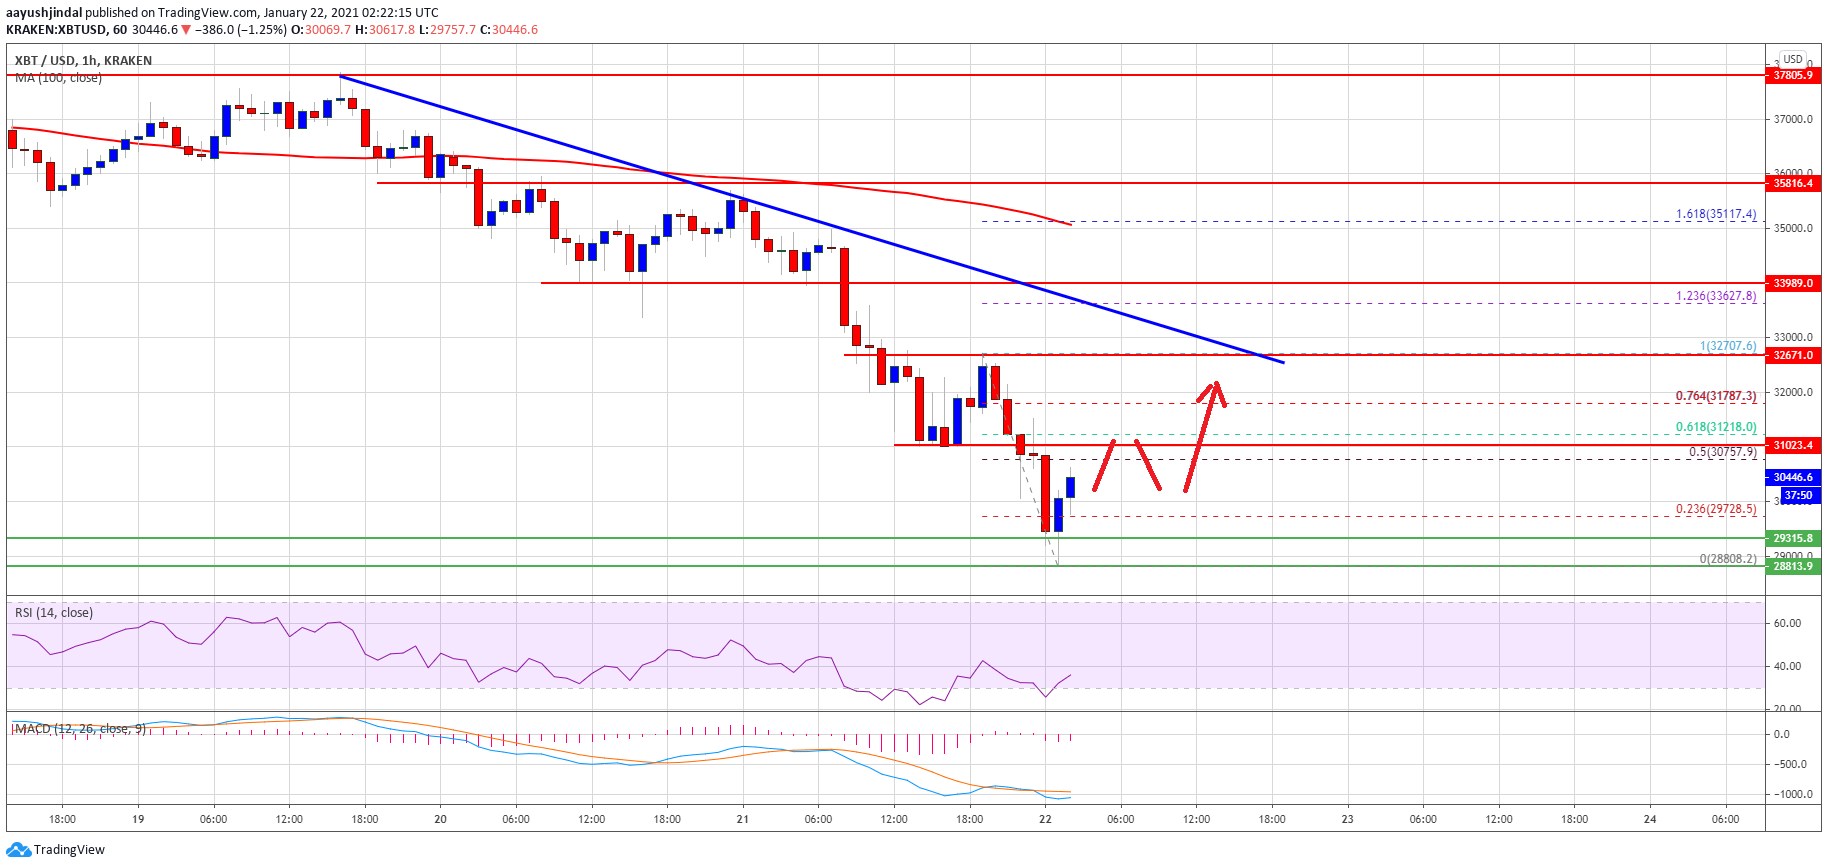
Source: BTCUSD on TradingView.com
On the upside, the first resistance is near the $30,800 and $31,000 levels. The 50% Fib retracement level of the recent decline from the $32,707 high to $28,808 low is also near the $30,800 level. The next key resistance is near the $32,000 level.
There is also a key bearish trend line forming with resistance near $32,700 on the hourly chart of the BTC/USD pair. To move into a positive zone, the price must clear $32,800 and $33,000 (support turned resistance).
More Downsides in BTC?
If bitcoin fails to recover above $31,000 and $31,800, there is a risk of another decline. An initial support on the downside is near the $30,000 level.
The first major support is near the $28,800 and $28,500 levels. A close below the $28,000 support zone could open the doors for a drop towards the $25,000 support zone in the coming sessions.
Technical indicators:
Hourly MACD – The MACD is slowly gaining momentum in the bullish zone.
Hourly RSI (Relative Strength Index) – The RSI for BTC/USD is now recovering towards the 40 level.
Major Support Levels – $30,000, followed by $28,800.
Major Resistance Levels – $30,800, $31,000 and $32,800.
Source: Read Full Article