Ripple Resumes Downward Correction after a False Breakout at $1.12

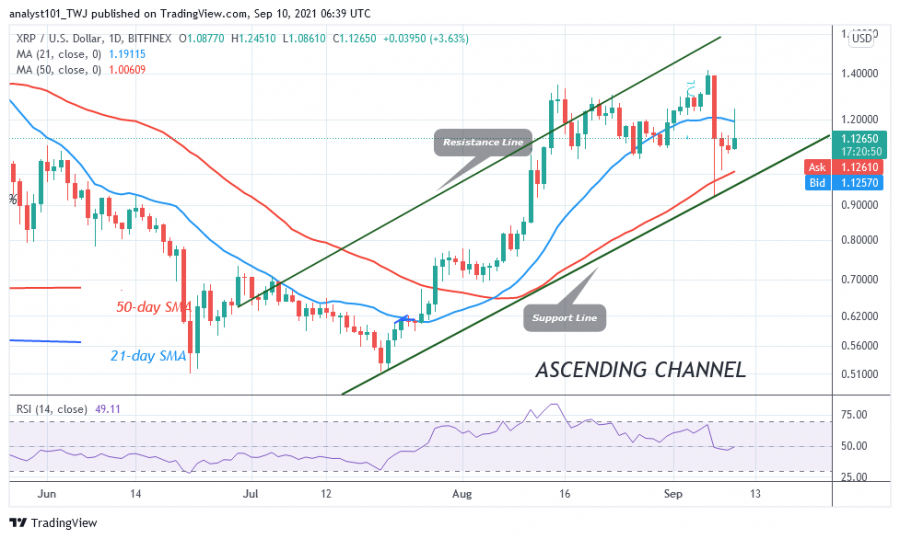
Today, Ripple (XRP) saw a sudden price spike to a high of $1.25. Today's price action resembles a vertical rally that is not supported by any fundamentals. XRP price broke through the 21-day line SMA and attempted to reach the overriding resistance at $1.40.
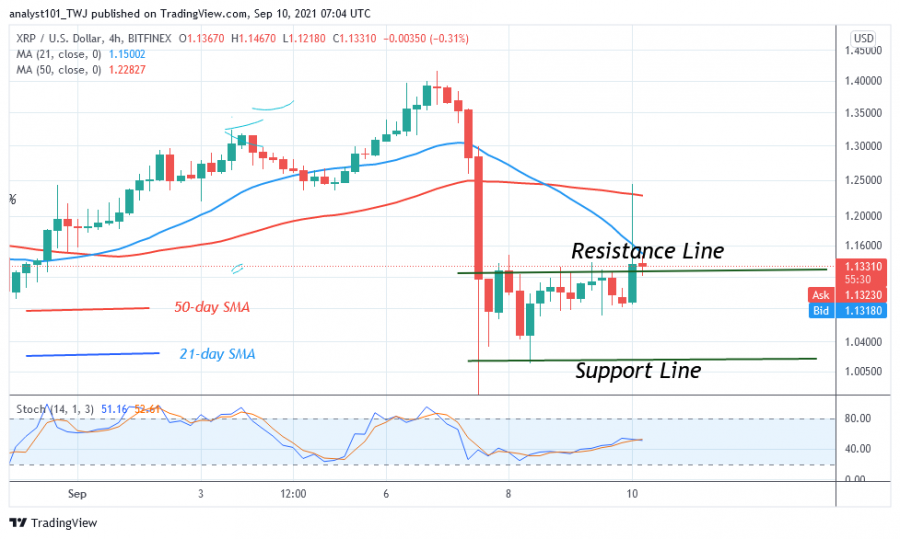
The bullish momentum missed its target area and the price retreated into the range zone. Today’s candlestick has a long wick. This indicates strong selling pressure at higher levels. XRP’s upside is doubtful as bears continue to defend resistance zones. XRP/USD is likely to remain below the $1.12 resistance for a few more days. The cryptocurrency is in a downward correction after the recent breakdown.
Ripple indicator analysis
The market has fallen to the 47 level of the Relative Strength Index of period 14. This indicates that Ripple is in a downtrend and is capable of falling to the downside. The cryptocurrency is trying to break out above the 21-day line SMA. The upward movement of the cryptocurrency will accelerate if the bulls break out above the 21-day line SMA. However, XRP is below the 40% range of the daily stochastic. This suggests that Ripple is in a bearish momentum.
Technical indicators:
Major Resistance Levels – $1.95 and $2.0
Major Support Levels – $0.80 and $0.60
What is the next move for Ripple?
XRP/USD is in a fluctuation range between the $1.00 and $1.12 levels, and the current price fluctuation is likely to continue in a price range. Ripple will resume the trend when the fluctuation range is broken. The altcoin is finding support above the 50-day line SMA.
Disclaimer. This analysis and forecast are the personal opinions of the author are not a recommendation to buy or sell cryptocurrency and should not be viewed as an endorsement by CoinIdol. Readers should do their own research before investing.
Source: Read Full Article


