Litecoin (LTC) Price Analysis: Risk of More Downsides Below $160
Litecoin price is struggling to clear the $200 barrier against the US Dollar, similar to bitcoin. LTC price is likely to resume its decline as long as it is below $220.
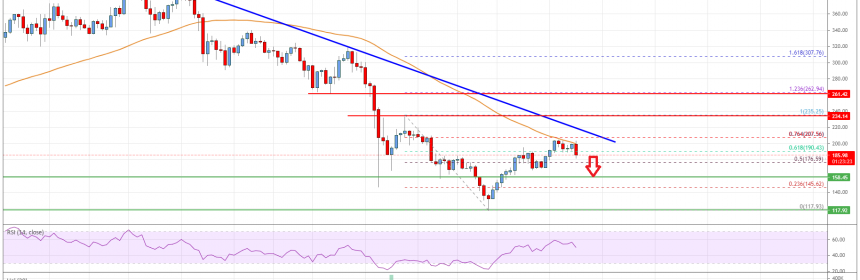
Litecoin Price Analysis
This past week, there was a sharp decline in bitcoin, ethereum, ripple, and litecoin against the US Dollar. LTC broke many supports near $250 and $220. It even broke the $200 support and settled well below the 55 simple moving average (4-hours).


Litecoin (LTC) Price
It traded as low as $117 and it is now correcting higher. There was a break above the $150 and $155 resistance levels. The bulls pushed the price above the 50% Fib retracement level of the recent decline from the $235 swing high to $117 low.
However, the price is struggling to clear the $200 resistance zone. There is also a crucial bearish trend line forming with resistance near $210 on the 4-hours chart of the LTC/USD pair.
The trend line is close to the 76.4% Fib retracement level of the recent decline from the $235 swing high to $117 low. A clear break above the trend line is needed for a push towards the $220 level. The next major resistance is near the $235 high.
Any more gains could lead the price towards the $262 resistance zone in the near term. If there is no upside break, the price could start a fresh decline. An initial support on the downside is near the $155 level. The next major support could be near the $120 zone. Any more losses might call for a drop towards the $100 level.
Looking at the chart, litecoin price is now trading well below $200 and the 55 simple moving average (4-hours). Overall, the price is likely to accelerate lower as long as it is below $200 and $220.
Technical indicators
4 hours MACD – The MACD for LTC/USD is slowly losing pace in the bullish zone.
4 hours RSI (Relative Strength Index) – The RSI for LTC/USD is struggling to stay above the 50 level.
Key Support Levels – $155 and $120.
Key Resistance Levels – $200 and $220.
Source: Read Full Article