Litecoin Falls As Bears Threaten To Break $100 Support

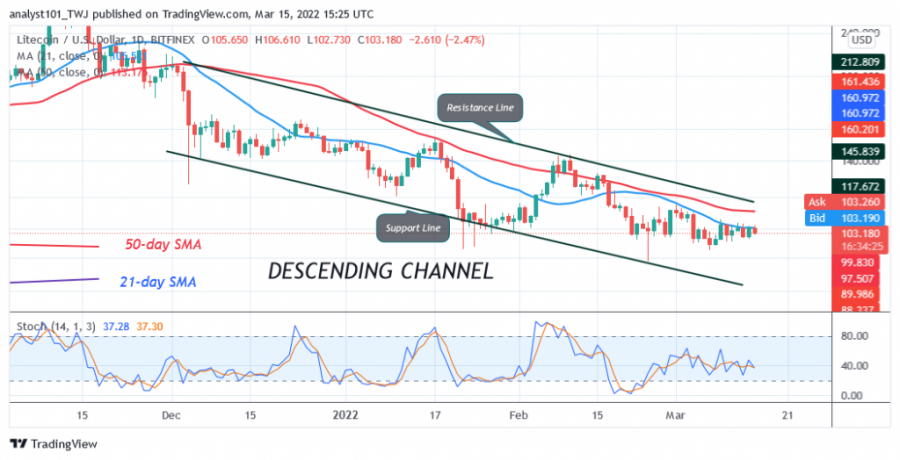
Litecoin (LTC) price is in a downward correction as the altcoin trades below the moving averages.
Litecoin price long-term forecast: bearish
After the price rally on February 9, the altcoin rose to a high of $140 as the bulls rose above the moving averages. After the rejection, buyers found it difficult to keep the price above the moving averages, hence the downward correction.

At the time of writing, Litecoin is trading at $103. The downtrend has eased after the January 22 price drop, when altcoin fell to the low of $96. Buyers defended the $100 support as Litecoin traded between $96 and $140.
On March 14, the upside was staved off at the 21-day moving averages line. Today, Litecoin is bearish after rejecting the recent high. If the bears break the $100 support to the downside, the market will fall to the low of $0.91.
Litecoin indicators analysis
The 21-day moving average line is a resistance for the cryptocurrency. The market will fall as long as the cryptocurrency price bars are below the moving averages. Litecoin is below the 40% range of the daily stochastic. The stochastic bands are sloping horizontally, indicating a sideways movement. The market is in a bearish momentum.
Technical Indicators:
Resistance Levels: $240, $280, $320
Support Levels: $200, $160, $120
What is the next move for Litecoin?
On February 24, Litecoin fell to a low of $96 as bulls bought dips. After the upside correction, LTC/USD continued to move sideways between $96 and $140. Today, the sideways movement continues. Neither the bulls nor the bears have broken the fluctuation range. The altcoin will develop when the range bound levels are broken.
Disclaimer. This analysis and forecast are the personal opinions of the author are not a recommendation to buy or sell cryptocurrency and should not be viewed as an endorsement by CoinIdol. Readers should do their own research before investing funds.
Source: Read Full Article