Ethereum Price Analysis: ETH Sits At A Crucial Juncture
Ethereum price is declining below $1,600 against the US Dollar. ETH/USD remains at a risk of more downsides below the $1,450 support zone.
Ethereum Price Analysis
This past week, ethereum struggled to clear the $1,700 resistance zone against the US Dollar. ETH price attempted a few times to clear the $1,700 level but failed.

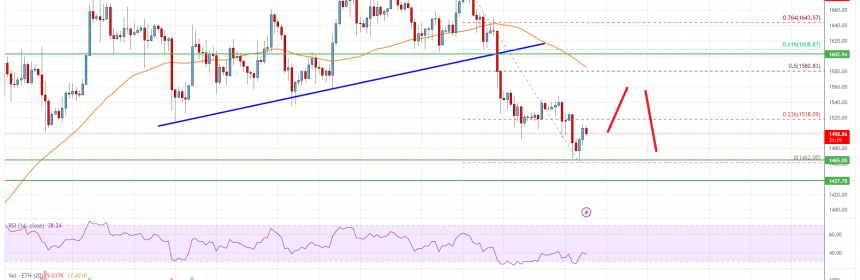
A swing high was formed near $1,699 and the price started a fresh decline. There was a drop below the $1,620 and $1,600 support levels. Besides, there was a break below a key bullish trend line with support near $1,600 on the 4-hours chart.
The pair even declined below the $1,550 support. A low is formed near $1,462 and the price is now consolidating losses. It is now trading below $1,600 and the 55 simple moving average (4-hours).
On the upside, the price is now facing resistance near the $1,520 level. It is near the 23.6% Fib retracement level of the main drop from the $1,699 swing high to $1,462 low. The next major resistance is near the $1,540 level, above which the price might rise steadily.
The next major resistance is near the $1,580 zone or the 50% Fib retracement level of the main drop from the $1,699 swing high to $1,462 low. The main resistance is near the $1,600 zone.
A clear move above the $1,600 and $1,610 resistance levels might call for a fresh move to $1,700. Any more gains could even send the price towards the $1,780 resistance zone or even $1,840 in the near term.
On the downside, an initial support is near the $1,460 level. The next major support is now near the $1,440 level. A break below the $1,440 support could push the price to $1,320. If the bulls fail to protect the $1,320 support, the price might decline towards $1,200.

Ethereum Price
Looking at the chart, Ethereum price is clearly trading below $1,600 and the 55 simple moving average (4-hours). Overall, ether price could recover, but it is likely to face sellers near the $1,580 resistance zone.
Technical indicators
4 hours MACD – The MACD for ETH/USD is now losing momentum in the bullish zone.
4 hours RSI (Relative Strength Index) – The RSI for ETH/USD is now below the 50 level.
Key Support Levels – $1,460, followed by the $1,440 zone.
Key Resistance$ Levels – $1,580 and $1,600.
Source: Read Full Article