Ethereum Is In Its Range-Bound Move, But Faces Rejection At $1,920

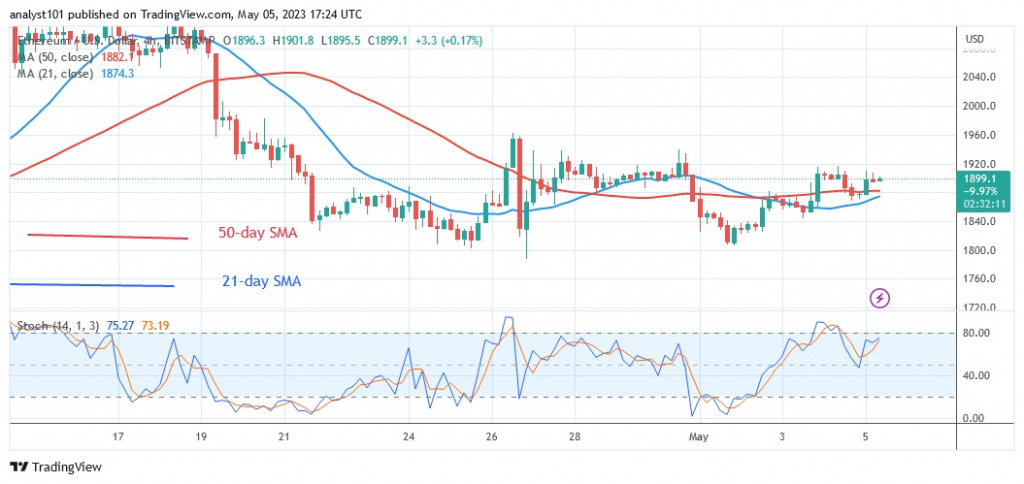
The Ethereum price (ETH) has been stuck between moving average lines since April 21. The bears broke below the 50-day line SMA on May 1, freeing Ether from its captivity. However, the largest altcoin returned to the range of fluctuation as the bulls bought the dips.
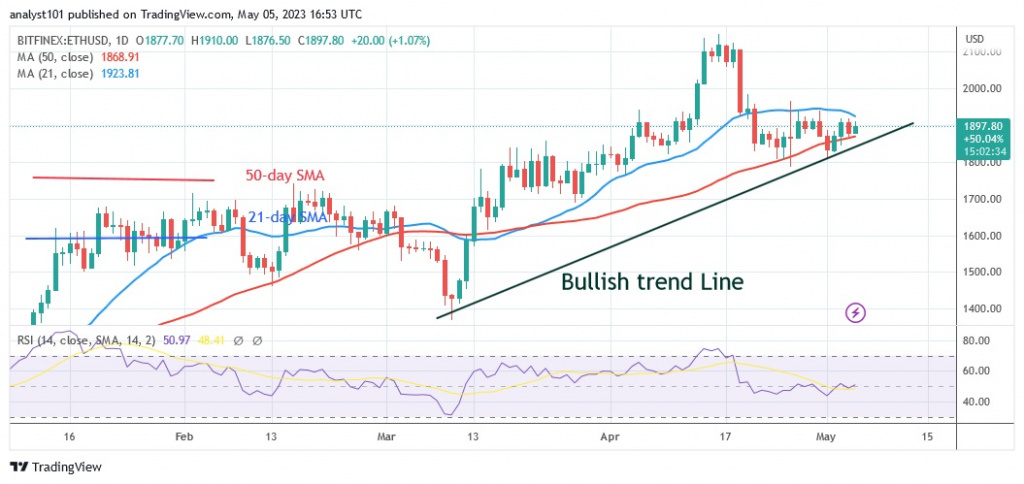
Long-term analysis of the Ethereum price: bearish
Ether costs $1,897.90 at the time of writing, and currently both the moving average lines and Ether are in line. In other words, the price is hovering between $1,800 and $1,960. If the bears break below the current support, the biggest altcoin will fall to the next support at 1,700. On the plus side, if Ether rises above $1,960 or the 21-day line SMA, it will rise above the high of $2,000. However, the largest altcoin will continue to range if the current support and resistance hold.
Analysis of Ethereum indicators

The largest altcoin is at level 51 of the Relative Strength Index for period 14. Currently, the altcoin is trading at its equilibrium price. This indicates a balance between supply and demand. However, since the price bars are between the moving average lines, the range bound movement could continue. The altcoin is in an upward momentum, but as it approaches the overbought area, the momentum has slowed down.
Technical indicators:
Key resistance levels – $2,000 and $2,500
Key support levels – $1,800 and $1,300
What is the next direction for Ethereum?
The price of Ether is being held back by the moving average lines. The altcoin will be forced to move in a range for a short period of time. Ether will move when the moving average lines are crossed. Price action is dominated by Doji candlesticks at the moment, which is why prices move slowly.
Disclaimer. This analysis and forecast are the personal opinions of the author and are not a recommendation to buy or sell cryptocurrency and should not be viewed as an endorsement by CoinIdol. Readers should do their research before investing in funds.
Source: Read Full Article