Ethereum Falls, Bears Threaten To Short Below $1,800 Low

The Ethereum price has resumed selling pressure as the bears have broken below the moving average lines.
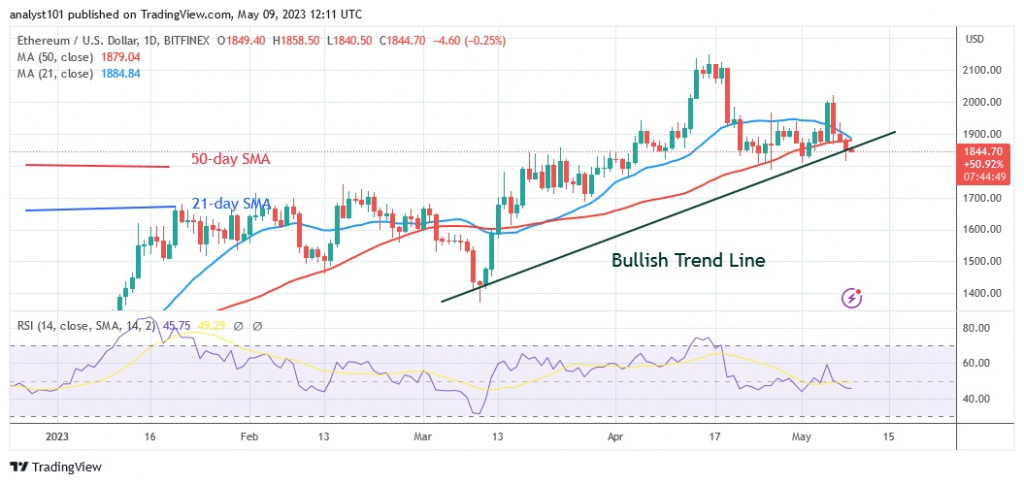
Long-term analysis of the Ethereum price: bearish
The largest altcoin was previously trapped between the moving averages since April 21. Ether has also been fluctuating in a range between $1,800 and $1,960 since the April 21 price drop, and at the time of writing, Ether is currently selling at $1,840. If the bears break the $1,800 support, Ether will fall much further to the lower edge of the $1,700 support. With Ether falling below the moving average lines, an upside move is doubtful. The $1,960 barrier and moving average lines will make it difficult for the bulls to gain ground. While the bears are trying to break the $1,800 support, Ether prices are falling now.
Ethereum indicator analysis

On the Relative Strength Index for period 14, the largest altcoin is at level 45. Ether is currently in a bearish trend zone and could fall further. As the selling pressure on Ether is picking up, the price bars are no longer trapped within the moving average lines. Although Ether is above the 25 level of the daily stochastic, it has dipped into the oversold zone. The bullish momentum is weakening.
Technical indicators:
Key resistance levels – $2,000 and $2,500
Key support levels – $1,800 and $1,300
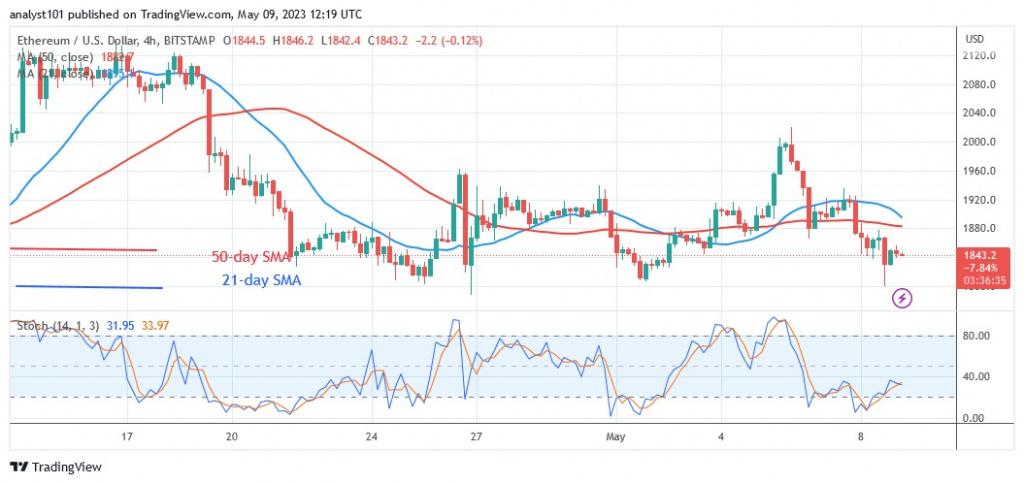
What is the next direction for Ethereum?
On the 4-hour chart, Ether shows a price decline when it falls below the moving average lines. The price of the cryptocurrency rose but encountered resistance just before the high at $1,920. With the break of the support level of $1,865, the Ether price is falling. Selling pressure will increase again.
Disclaimer. This analysis and forecast are the personal opinions of the author and are not a recommendation to buy or sell cryptocurrency and should not be viewed as an endorsement by CoinIdol. Readers should do their research before investing in funds.
Source: Read Full Article