BTC/USD Falls More than 17% in Stop Hunt: Sally Ho’s Technical Analysis 4 January 2021 BTC
Bitcoin (BTC/USD) regained some lost ground early in today’s North American session as the pair appreciated to the 32246.07 area after trading as low as the 27678 area during the European session, with the intraday low representing a test of the 38.2% retracement of the recent appreciating range from 16200 to 34810. The next downside retracement levels in this range include 25505 and 23309.02. BTC/USD peaked at a fresh lifetime high of 34810 yesterday before coming off. Stops were elected below many retracement areas during the pullback lower, including the 32667.16, 31766.51, 31357.69, 30743.72, 30418.04, 30218.69, 29395.73, and 28258.75 levels. Traders notice that BTC/USD lost more than 17% in short order today, a move that accelerated after profit-taking ensued below the 34000 figure.
Stops were recently elected above some upside price objectives today including 34446.27, 34603.65, and 34697.35, levels that are technically significant due to previous buying activity that originated around the 17580, 21913.84, and 16200 area. Additional upside price objectives include the 34937.10, 35300, 35943.73, and 36480.83 areas. Following the pair’s recent moves to successive all-time highs, downside retracement levels and areas of potential technical support include the 27028.64, 26761.87, 25833.73, 25008.84, 24594.94, 24090.75, and 23337.14 levels. BTC/USD traded up more than 44% in January, and closed 2020 with a gain of approximately 292%. Traders are observing that the 50-bar MA (4-hourly) is bullishly indicating above the 100-bar MA (4-hourly) and above the 200-bar MA (4-hourly). Also, the 50-bar MA (hourly) is bullishly indicating above the 100-bar MA (hourly) and above the 200-bar MA (hourly).

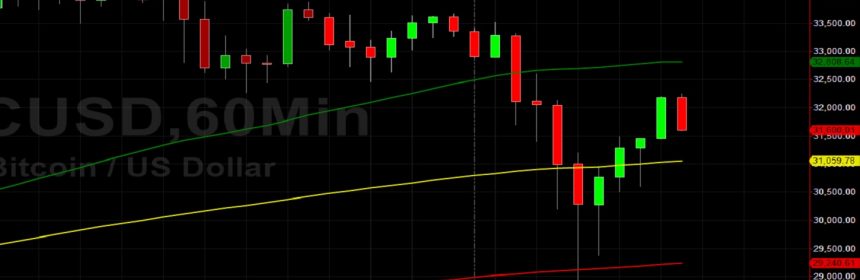
Price activity is nearest the 50-bar MA (4-hourly) at 29265.81 and the 100-bar MA (Hourly) at 31060.39.
Technical Support is expected around 27505.33/ 26195.00/ 25505.00 with Stops expected below.
Technical Resistance is expected around 34937.10/ 35300.00/ 35943.73 with Stops expected above.
On 4-Hourly chart, SlowK is Bearishly below SlowD while MACD is Bearishly below MACDAverage.
On 60-minute chart, SlowK is Bullishly above SlowD while MACD is Bearishly below MACDAverage.
Related TAGS:
You can share this post!
Source: Read Full Article