Bitcoin Plunges Below $27,000, Which Holder Groups Are Selling?

Bitcoin has plunged below the $27,000 mark during the past day. Here are the market segments that are possibly participating in this selloff.
These Bitcoin Investors Have Been Spending Their Coins Recently
In a new tweet, the on-chain analytics firm Glassnode has broken down the prices at which the average coins sold today were bought. Generally, the BTC market is divided into two main segments: the long-term holders (LTHs) and the short-term holders (STHs).

The STHs comprise a cohort including all investors who acquired their Bitcoin within the last 155 days. The LTHs, on the other hand, are investors who have been holding for more than this threshold amount.
In the context of the current discussion, the relevant indicator is the “dormancy average spending ranges,” which finds out the periods in which the average coins being spent/transferred by these two groups were first acquired.
For example, if the metric shows the 7-day spending range for the LTHs as $20,000 to $30,000, it means that the coins these investors sold in the past week were initially bought at prices in this range.
Here is a chart showing the data for the current 7-day dormancy average spending ranges for the STHs and LTHs, as well for the combined market.
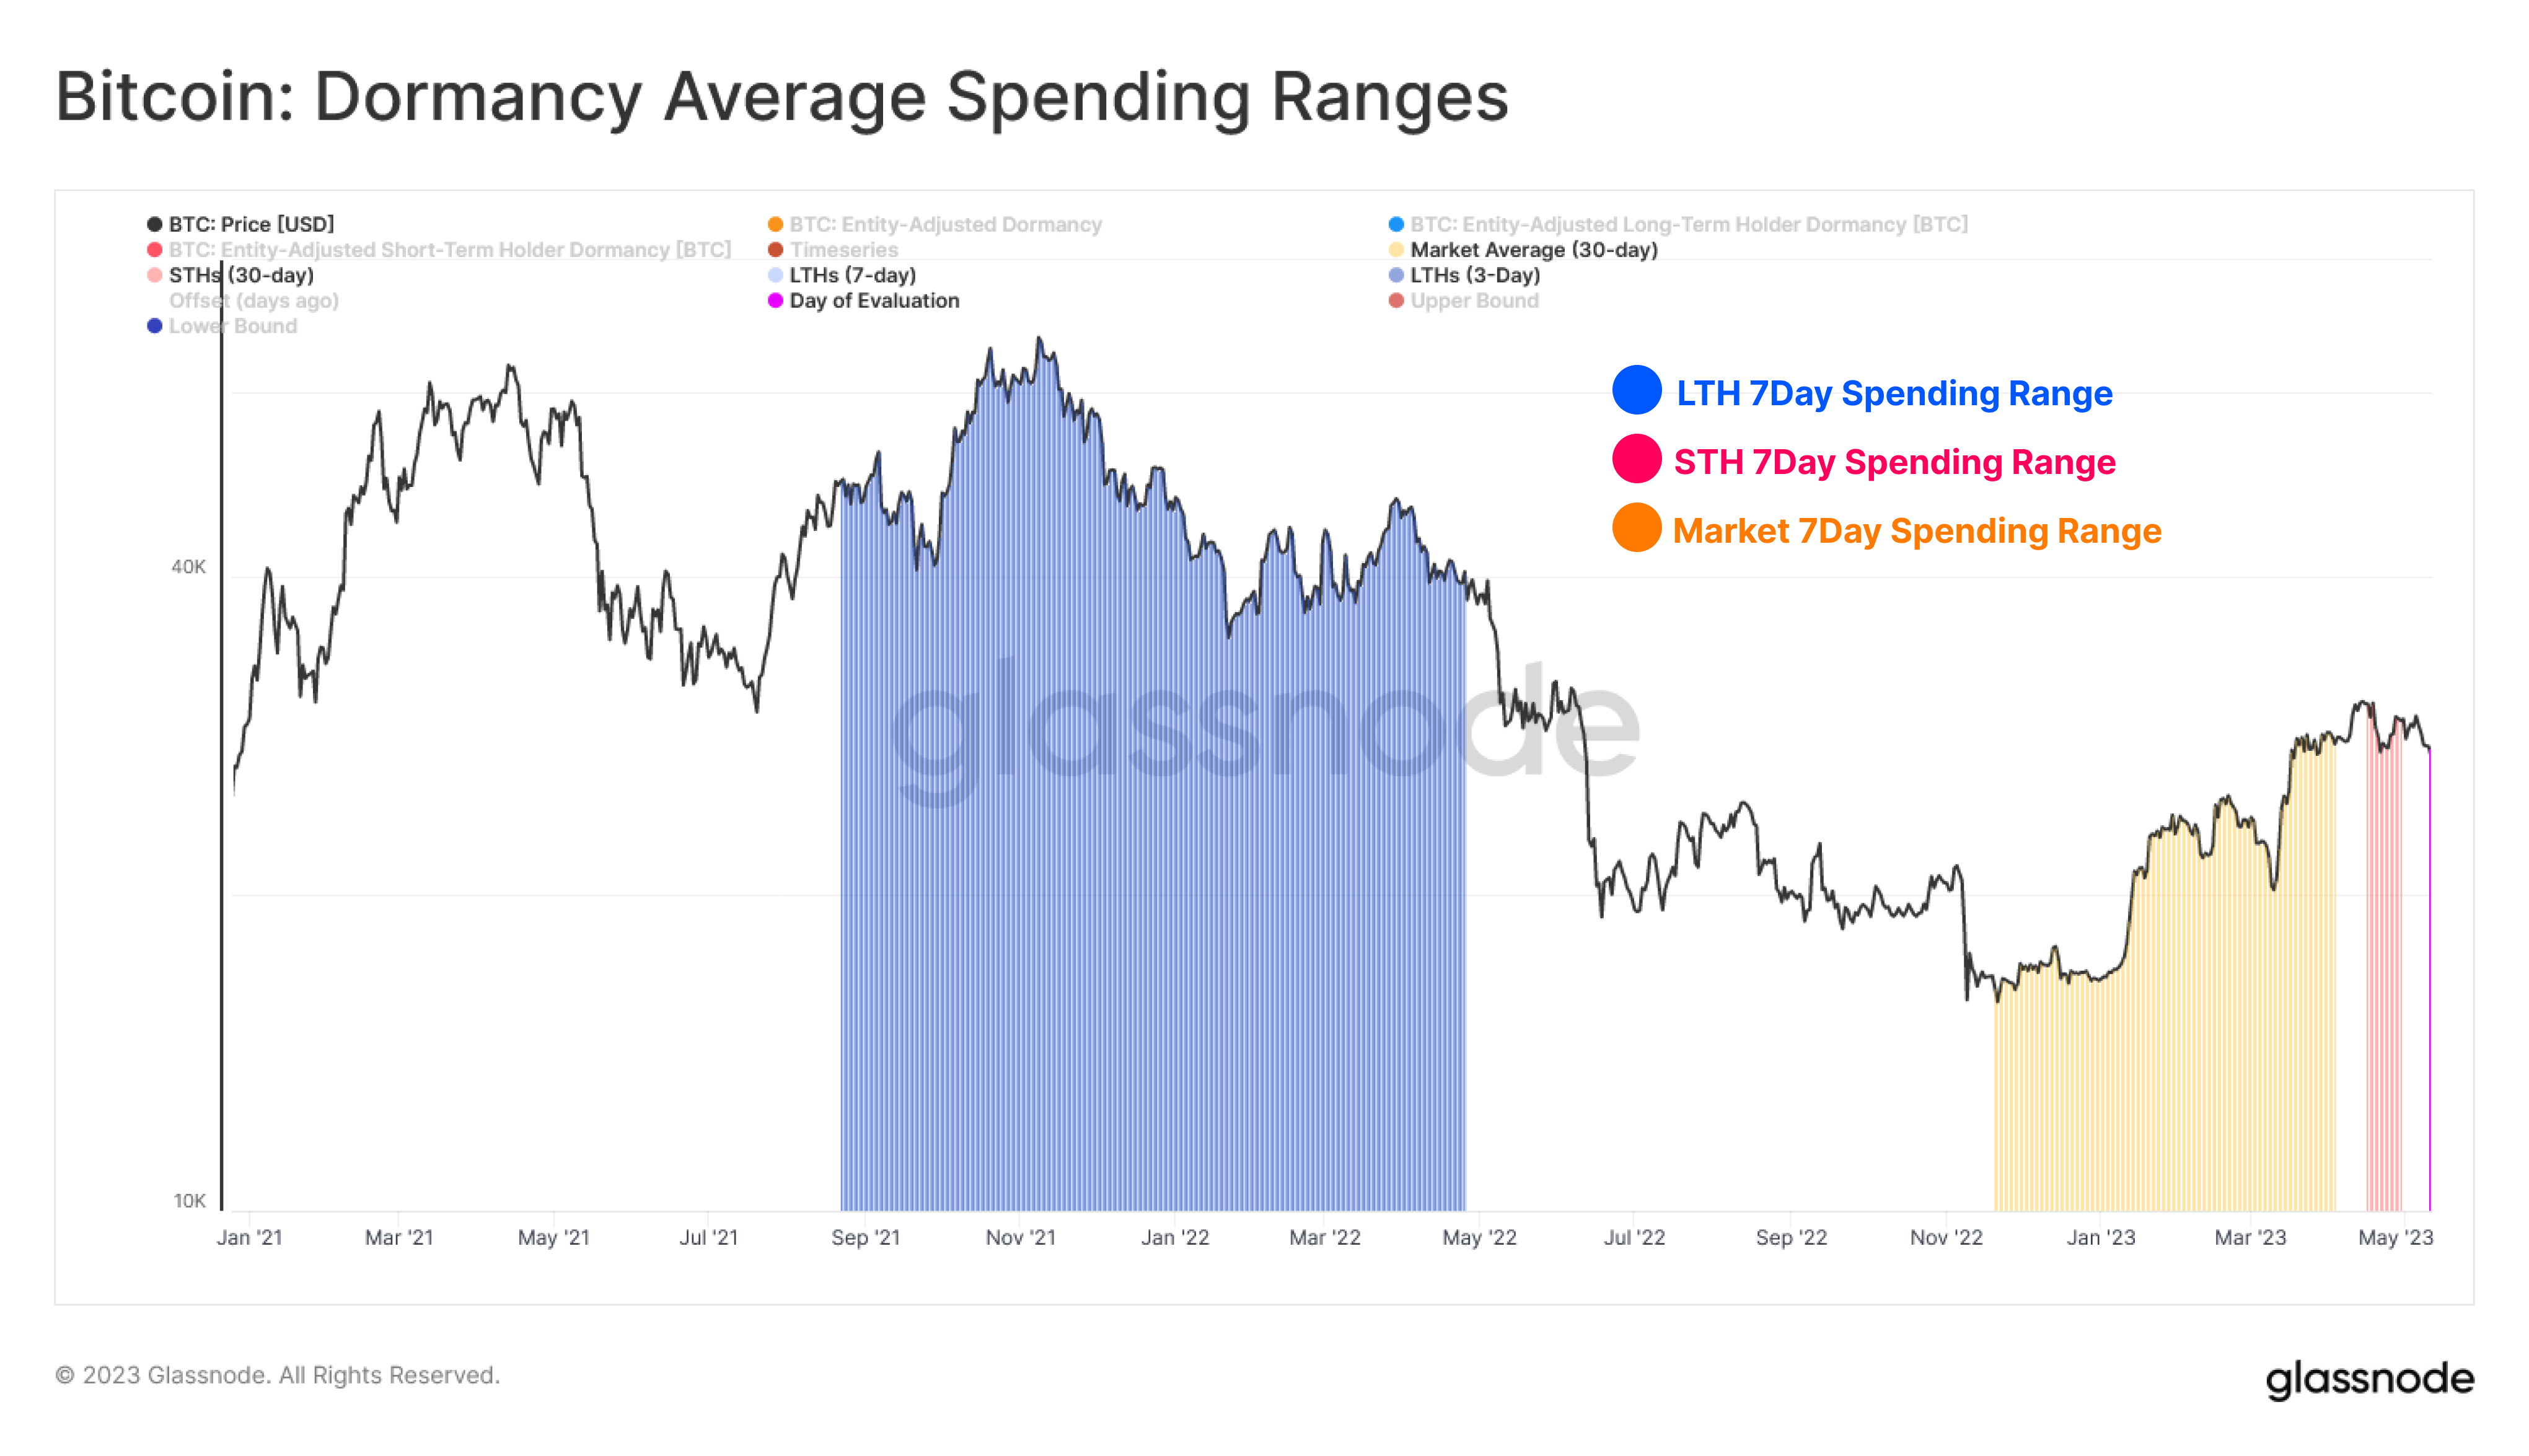
The different average spending ranges of the main segments of the sector | Source: Glassnode on Twitter
The graph shows that the 7-day average spending range for the STHs is quite close to the current prices at $30,400 to $27,300. Some of these sellers bought at higher prices than those observed in the past week, so they must have been selling at a loss (although not a particularly deep one).
The indicator puts the LTHs’ acquisition range at $67,600 to $35,000. As highlighted in the chart, the timeframe of these purchases included the lead-up to the November 2021 price all-time high, the top itself, and the period when the decline towards the bear market first started.
It would appear that these holders who bought at the high bull market prices have budged because of the pressure the cryptocurrency has been under lately and have finally decided to take their losses and move on.
Generally, the longer an investor holds onto their coins, the less likely they become to sell at any point. This would perhaps explain why the acquisition timeframe of the current STHs is so recent; the fickle ones are those who have only been holding a short while.
For the BTC LTHs, however, the probable reason why the acquisition period of the average seller from this group is so far back, rather than nearer to 155 days ago (the cutoff of the youngest LTHs), is that a lot of the younger LTHs would be in profits currently as they bought during the lower, bear-market prices.
As such, the Bitcoin investors more likely to waver in their conviction right now would be those holding the most severe losses, the 2021 bull run top buyers.
The chart also includes the 7-day average spending range for the combined BTC sector, and as one may expect, this range lies in the middle of the two cohorts ($15,800 to $28,500), but the timeframe is closer to the STHs, as a lot of the sellers are bound to be recent buyers.
BTC Price
At the time of writing, Bitcoin is trading around $26,300, down 10% in the last week.

Source: Read Full Article