Binance Coin Moves Above $265 As It Reaches A Bearish Exhaustion Level

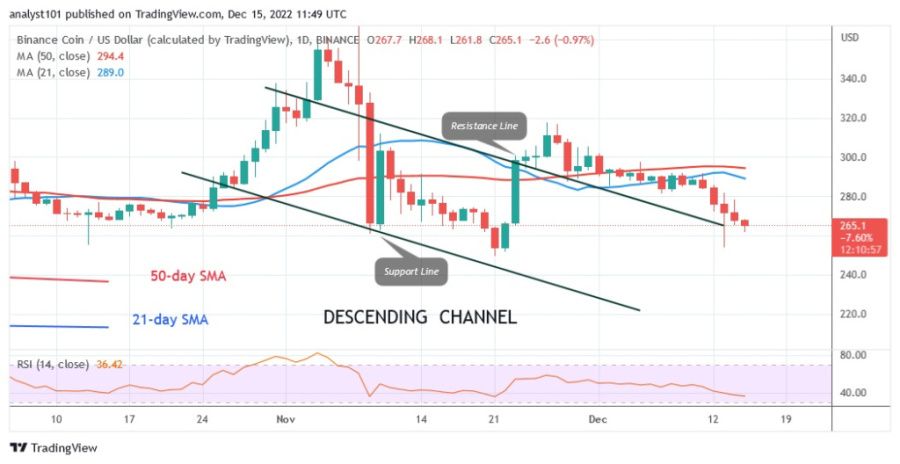
Binance Coin (BNB), which has fallen to a low of $265, has entered the down zone. Momentum will continue to go down until it reaches the bottom of the current support at $249.
Binance Coin price long term forecast: bearish
BNB is currently testing the historical price level of November 10 after falling today. Although it fell below the historical low of $265, bulls continued to buy on declines as it rose above the moving average lines. The former low will be tested again today. If the support at $265 holds, the altcoin will head back up. If the current support is broken, the cryptocurrency will fall to its low above the $200 support.
Binance Coin indicator display
The Relative Strength Index is for period 14, at level 36. Due to the rejection of the recent high, Binance Coin is currently trading in the bearish trend zone. Further decline is indicated by the position of the price bars below the moving average lines. Binance Coin’s Stochastic on the daily chart is trading below level 20 and in the oversold zone. This indicates that bearish exhaustion has been reached in terms of selling pressure.
Technical indicators
Key resistance levels – $600, $650, $700
Key support levels – $300, $250, $200
What is the next direction for BNB/USD?
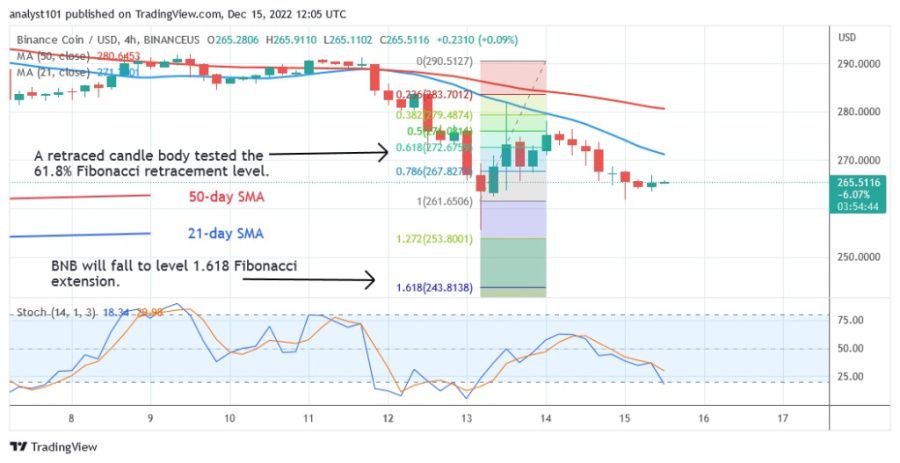
Binance Coin is moving down on the 4-hour chart as it faces resistance at the $280 high. The altcoin is likely to continue losing value, says the price indicator. BNB has corrected upwards after the December 13 loss and a candlestick has tested the 61.8% Fibonacci retracement level. BNB will fall through the correction to the 1.618 Fibonacci extension level, or $243.81.
Disclaimer. This analysis and forecast are the personal opinions of the author and are not a recommendation to buy or sell cryptocurrency and should not be viewed as an endorsement by CoinIdol. Readers should do their research before investing in funds.
Source: Read Full Article


