Key Technical Indicator Signals Bitcoin ($BTC) Price in Uptrend for First Time Since December 2021
Bitcoin ($BTC) has just seen a key technical indicator signal that the flagship cryptocurrency’s price has entered an uptrend for the first time since December 2021, when BTC dropped from around $50,000 to $43,000.
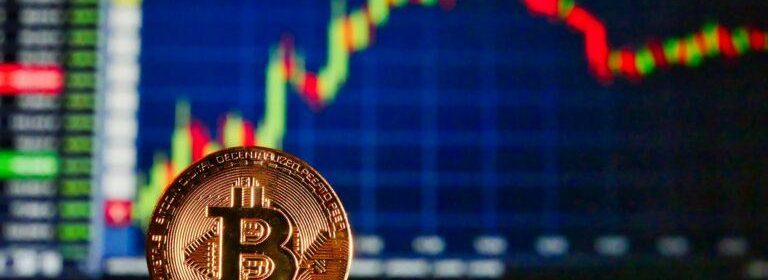
As first noted by popular cryptocurrency analyst Lark Davis, the flagship cryptocurrency is now trading above its 200-day moving average (MA) for the first time in over a year after the cryptocurrency price rallied over 20% in a week to surpass $21,000.

The 200-day moving average is seen as a key technical indicator by traders and market analysts, as it helps determine the overall long-term market trends. A moving average, according to Investopedia, is an indicator that helps “smooth out price data by creating a constantly updated average price.”
The indicator eliminates the impact of random, short-term price fluctuations on the price of an asset, and the 200-day moving average is seen as either a strong support level if the price of the asset is above it, or a strong resistance if the price is below it.
When an asset is above the 200-day moving average, it’s considered to be in an uptrend. Bitcoin’s price started trading above its 200-day moving average at about the same time its Fear & Greed Index rose to “neutral” with a score of 52 for the first time in months, after dropping to 6 – marking a state of “extreme fear” – with the collapse of FTX.
The index, it’s worth noting, is based on emotional behavior in the market. When fear sets in, some investors may see a buying opportunity, while greed may be a sign the market is due for a correction.
Earlier this week, a top cryptocurrency analyst that has gained a large following on social media after accurately in January 2018 bitcoin’s 84% decline throughout that year, from over $19,000 to a little over $3,000 in a year-long bear market, has suggested through two charts that there’s potential for Bitcoin to hit $150,000 by 2025.
Peter Brandt, who is one of the world’s most respected classical chartists, has shared charts on the microblogging platform Twitter with his nearly 700,000 followers that suggested $BTC is making an inverse head and shoulders pattern, which could push $BTC to $30,000 by the second quarter of this year.
Image Credit
Featured Image via Pixabay
Source: Read Full Article