Bitcoin Bulls Eye $61,000 As BTC Roars Past $47,500 in Classic Textbook Price Pattern

Bitcoin seems to be finally out of the woods after rallying past $45,000 following an eleven-week-long consolidation. As of writing, the pioneer cryptocurrency is trading at $47,503 and is up 16% in the past 7 days after printing a bullish ‘marubozu’ candlestick on Sunday.

Its principal competitor, Ethereum is up 5.7% on the day and 15% in the past week and is currently trading at $3358. Solana is the biggest gainer in the top ten categories having added 8.38% in the past twenty-four hours to trade at $109.43. Other cryptocurrencies such as ADA, DOT, DOGE, and SHIB are up, 7.27%, 7.06%, 6.08, and 13.15% in the past 24 hours respectively.
During the run-up, the total transaction volume of the crypto market exceeded $110 billion in the past 24 hours, an increase of 63.07% over the previous day. The total market value also surged to $2.13 trillion, a month-on-month increase of 4.75%, according to CoinMarketCap.
As per data from Coinglass, over $558 million has been liquidated across all cryptocurrencies with 88,031 short traders being liquidated in the last 24 hours. Over $170 million in Bitcoin has been forced to exit its positions in the same period. The largest liquidation order went down on BitMEX where a single entity lost $10M in XBTUSD.
As ZyCrypto reported, an imbalance between buyers and sellers has been the force behind Sunday’s peak of Bitcoin with a click of seasoned traders marking out a “bullish reversal triangle pattern” days before the price ‘broke and closed above the $45,000 resistance. The pattern, which goes down as a textbook one, meaning that it is easily recognized for its entries, stop loss, and take profit points has been one of the most elaborate and clear patterns on the bitcoin chart so far.
Peter Brandt, a veteran trader with over 40 years of trading experience shares a 2019 ascending triangle chart pattern similar to the one at hand. This is in contrast to his earlier suggestion that Bitcoin’s price could dump.

A classic symmetrical reversal triangle pattern contains a flat top as depicted above. The higher lows show that buyers are stronger than sellers, a phenomenon that is crucial in expectations of a price breakout. The profit target for such a pattern would be $61,000 (seen second yellow arrow which is a duplicate of the first.)
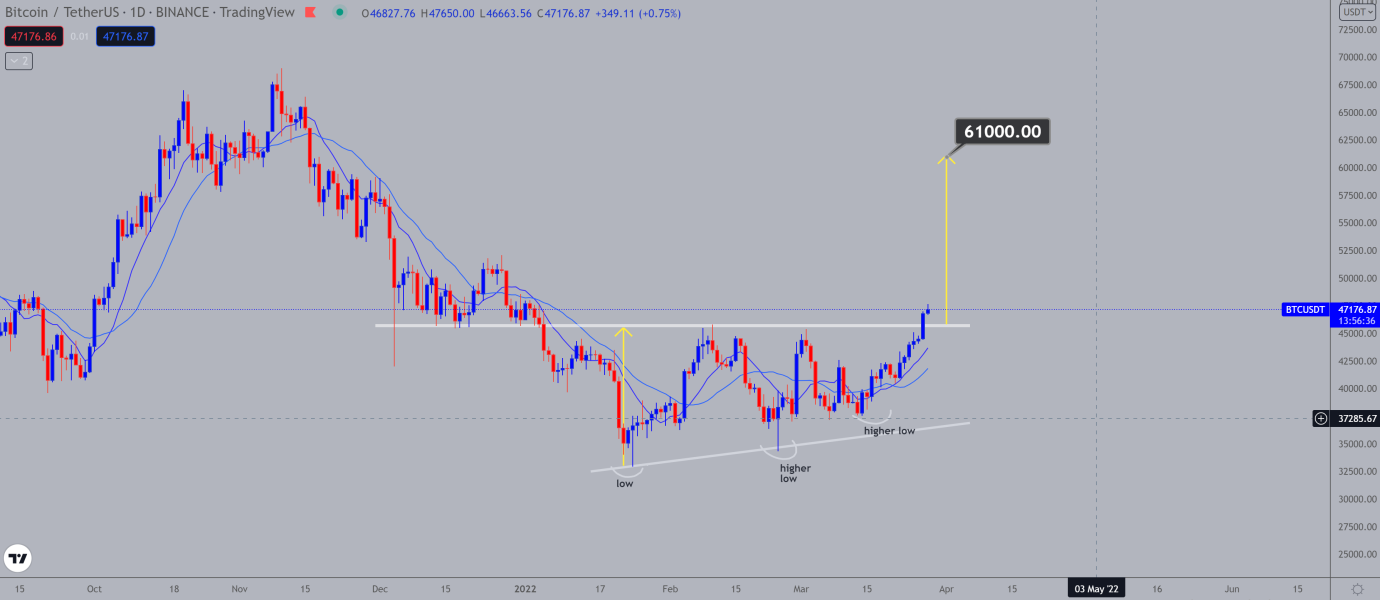
“Charts do NOT predict the future. Charts do NOT even offer probabilities. Charts suggest possibilities and are useful in managing the risks in a trading program. Chart patterns can work, fail or morph. If laser eyes reappear and $BTC stalls, then look out” Brandt however warns, even as traders project higher prices.
Source: Read Full Article