XRP Recaptures $0.50 Support And Resumes Horizontal Trend

Cryptocurrency analysts of Coinidol.com report, XRP price is moving again after the downtrend ended on August 17.
XRP price long-term forecast: fluctuating
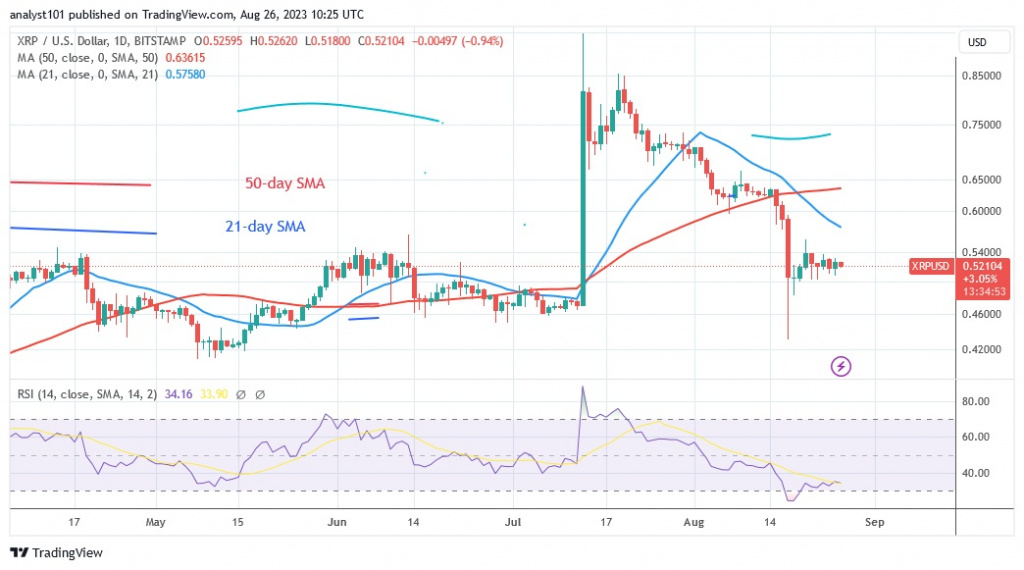
On August 17, the cryptocurrency price regained the support level of $0.50. XRP was trading between $0.48 and $0.56 last week. The price movement was subdued above the $0.50 support.
The cryptocurrency rose to a high of $0.55 on August 20, but was rejected. The altcoin has risen above the current support level. The presence of the doji candlesticks has slowed down the price movement. At the time of writing, the altcoin is trading at $0.52.
XRP indicator analysis
XRP is correcting to the upside and is currently at the 35 level of the Relative Strength Index for the 14 period. The cryptocurrency asset is in a downtrend and is likely to continue falling. The bullish momentum has paused above the daily stochastic threshold of 50. The lower period moving average lines are sloping horizontally, indicating a sideways trend.
Technical Indicators:
Key resistance levels – $0.80 and $1.00
Key support levels – $0.40 and $0.20
What is the next move for XRP?
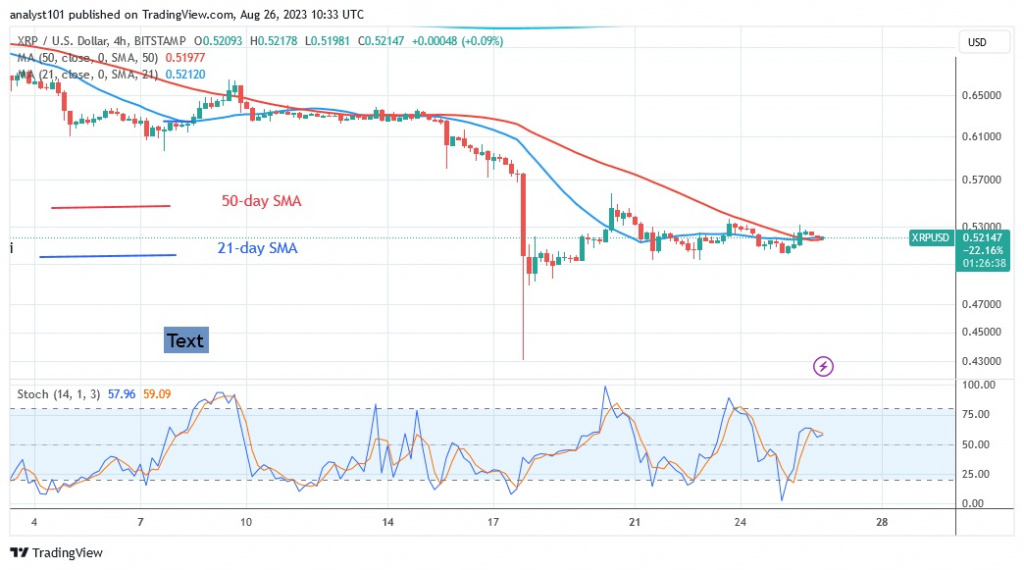
Doji candlesticks suggest that the price of XRP will trend sideways.
The altcoin is in a horizontal trend on the 4-hour chart. The candlesticks are moving below and above the moving average, indicating a sideways trend.
As we reported on August 19, the decline was short-lived as the cryptocurrency price quickly recovered above the $0.50 support level. The bearish momentum has eased over the last 48 hours as the altcoin consolidates above the current level.
Disclaimer. This analysis and forecast are the personal opinions of the author and are not a recommendation to buy or sell cryptocurrency and should not be viewed as an endorsement by CoinIdol.com. Readers should do their research before investing in funds.
Source: Read Full Article


