TRON Is In A Range, But Risks A Further Decline To $0.063

TRON (TRX) price is falling as it breaks below the moving average lines.
TRON price long-term forecast: bearish
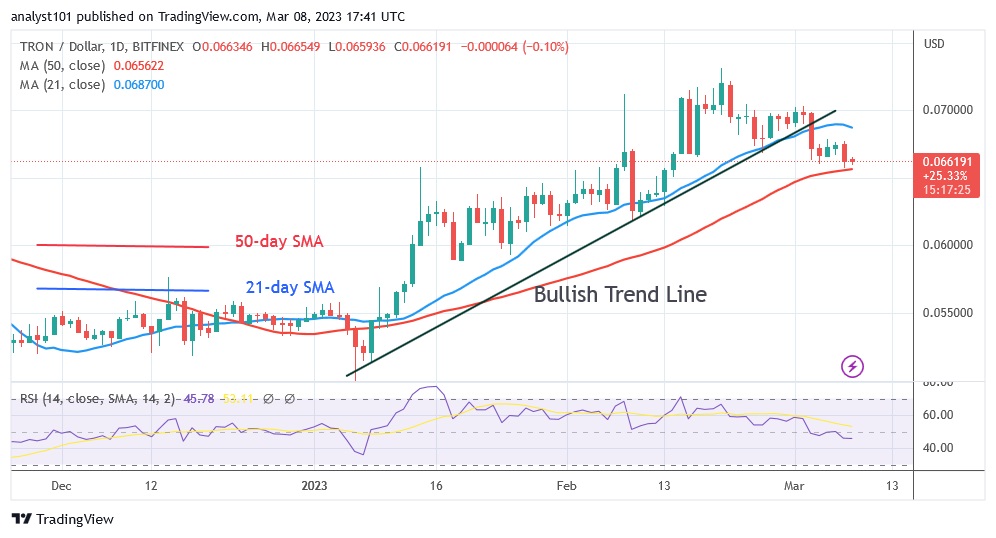
The value of the cryptocurrency has fallen to $0.066. If the price falls below the 50-day moving average, the current decline will accelerate. TRON will continue to fall to a low of $0.060. The altcoin has been trapped between the moving average lines since March 3. If the bears fail to break below the 50-day line SMA, TRON will be forced to trade in a range between the moving average lines. When the moving average lines are broken, the altcoin will develop a trend. For example, if the price breaks the 21-day line SMA, it indicates the resumption of an uptrend. TRON the previous high of $0.073 will be reached again.
TRON indicator display
TRON remains in the bearish trend zone for the period 14 on the Relative Strength Index of level 45. The price bars are between the moving average lines, indicating a possible sideways movement within the limited range. The moving average lines are skewed to the north, indicating an earlier uptrend. Bullish momentum has slowed above the daily Stochastic reading of 25.
Key supply zones: $0.07, $0.08, $0.09
Key demand zones: $0.06, $0.05, $0.04
What is the next direction for TRON?
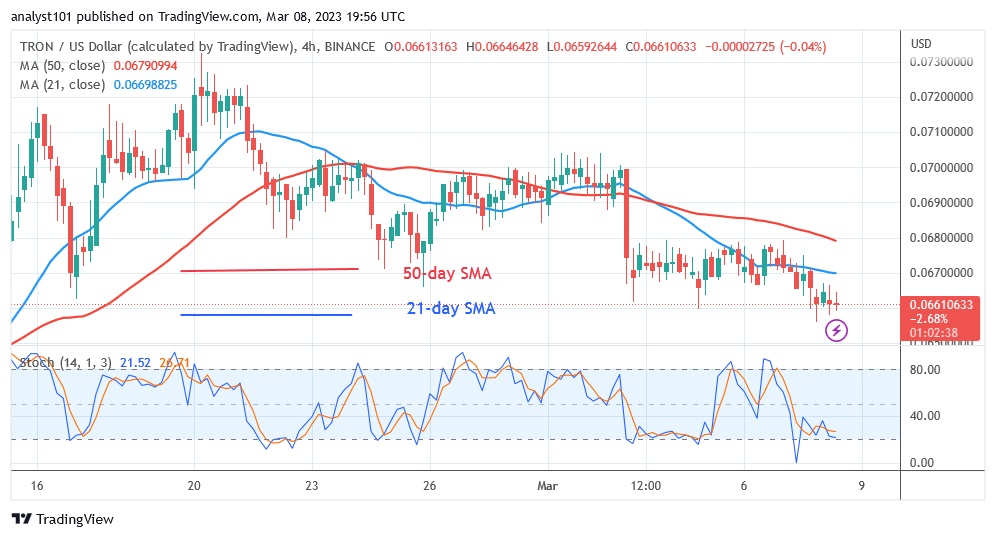
After the price decline on March 3, TRON is forced to trade sideways. The price of the altcoin is fluctuating in a narrow range between $0.065 and $0.068 on the 4-hour chart. Buyers will emerge in the oversold region to push the price higher as the altcoin has now reached the oversold region.
Disclaimer. This analysis and forecast are the personal opinions of the author and are not a recommendation to buy or sell cryptocurrency and should not be viewed as an endorsement by Coin Idol. Readers should do their own research before investing in funds.
Source: Read Full Article


