Solana Price May Fall To $21 Before It Stages Another Recovery

Over the last week, the price of Solana has risen. During the same time frame, SOL surged close to 17%. Although the bulls were in the market, SOL was not entirely out of the woods. The price was dragged to the $21 mark recently after the bears attempted to drag the price down.
The technical outlook of Solana depicted that the bulls were present on the one-day chart. Buying strength registered an increase as demand also moved up. With demand going north, accumulation also noted a positive change.
The asset’s price must remain above the $21 support level; otherwise, a fall through that price mark will bring the bears back in full force. As Bitcoin tries to break past the $28,500 level, other altcoins also attempt to target their immediate price ceiling.
The movement of the king coin will determine the price direction of other altcoins. The volatility of the SOL price will start declining once the demand for the altcoin stabilizes over the upcoming trading sessions.
Solana Price Analysis: One-Day Chart
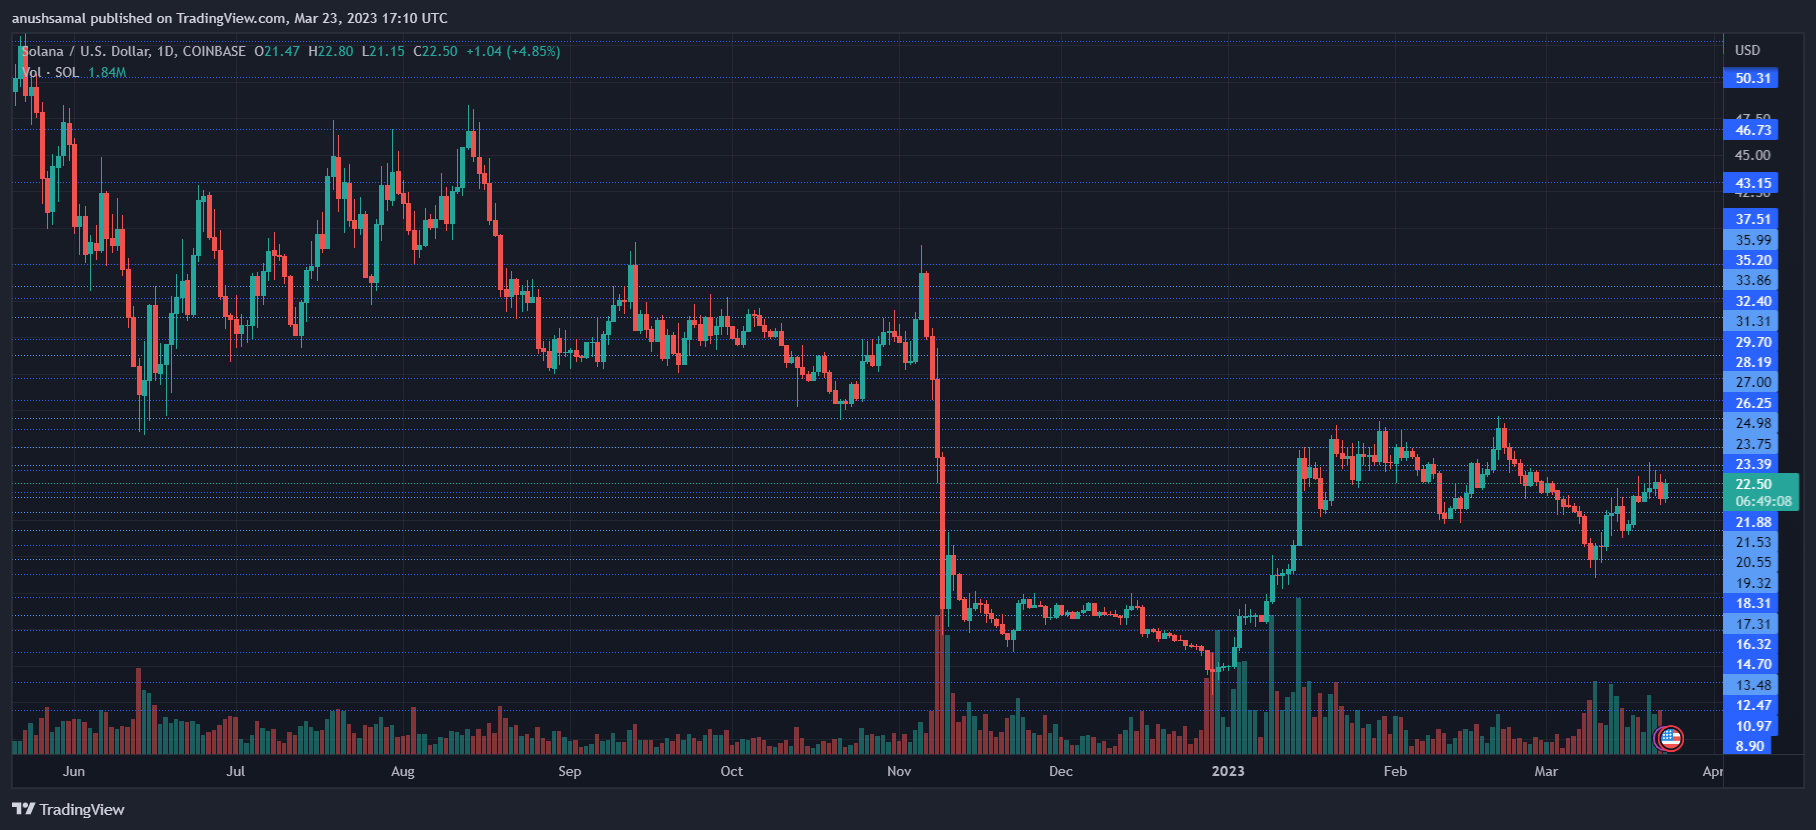
SOL was trading at $22.50 at the time of writing. Over the past trading sessions, however, the bears dragged the price to the crucial support line of $21.50. The local support level for the coin was $21.
The $21 price level has acted as a propelling point for the altcoin, so another dip to this level might shoot the price to $23 or above. The inability to sustain a price above $21 will bring SOL to $20.
On the other hand, overhead resistance for SOL was at $23.40; breaching past that will push the price to $24. This level may act as strict resistance for the altcoin.
Technical Analysis
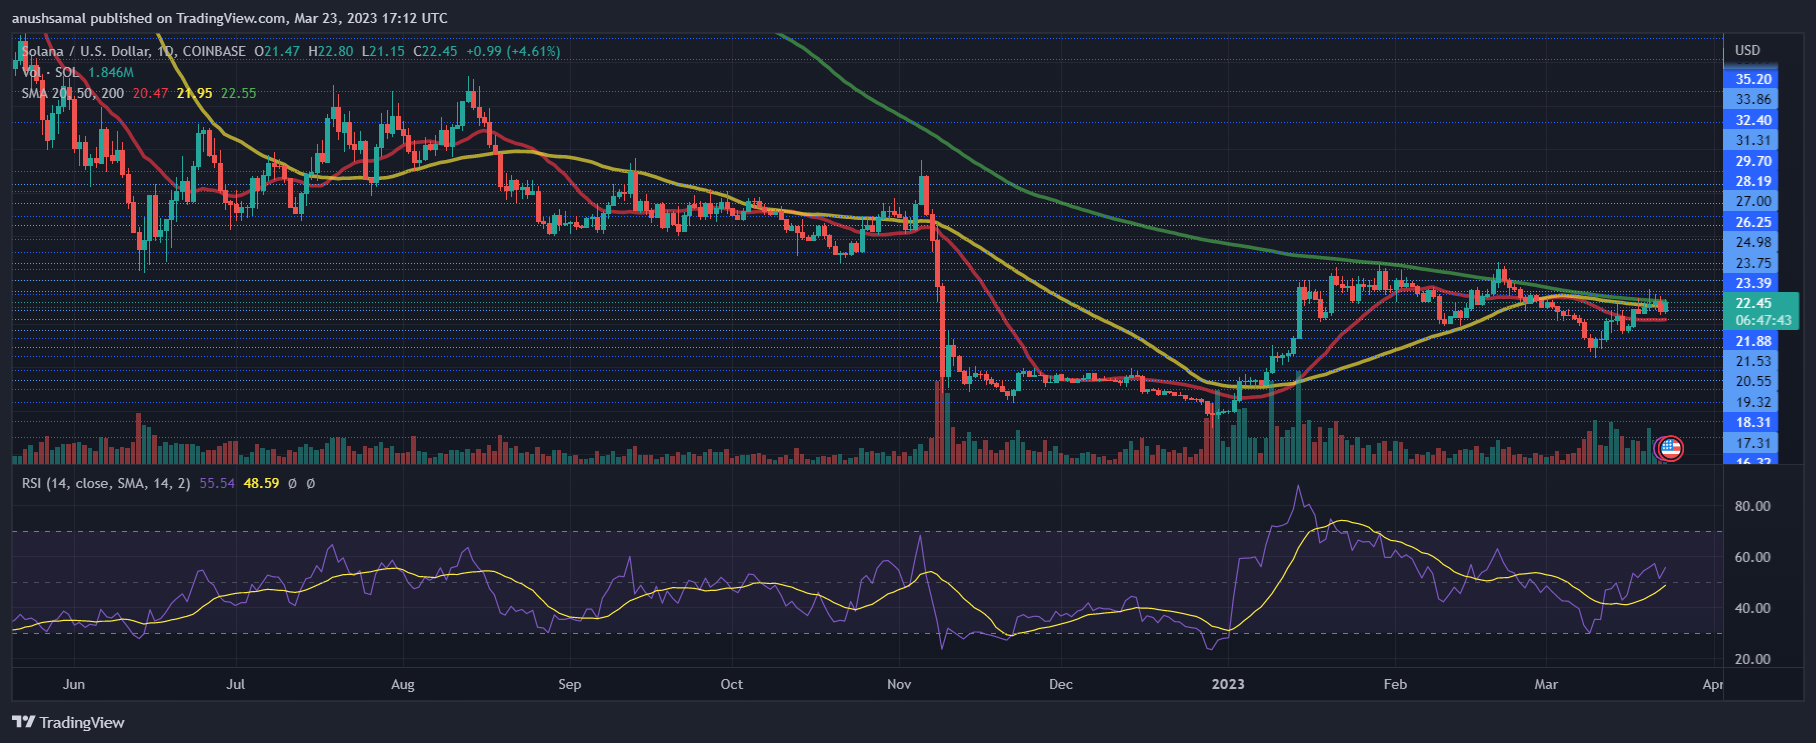
SOL has depicted a recovery in buying strength over the last trading session. The Relative Strength Index noted an uptick and moved near the 60-mark, meaning the buyers were in charge of the market. Similarly, with increased demand, SOL moved above the 20-Simple Moving Average (SMA) line.
This indicated that buyers were driving the price momentum in the market. SOL price is standing at a crucial point because a slight push from buyers will take the altcoin above the 50-SMA and 200-SMA lines, respectively. That would be a sign of increased bullishness.
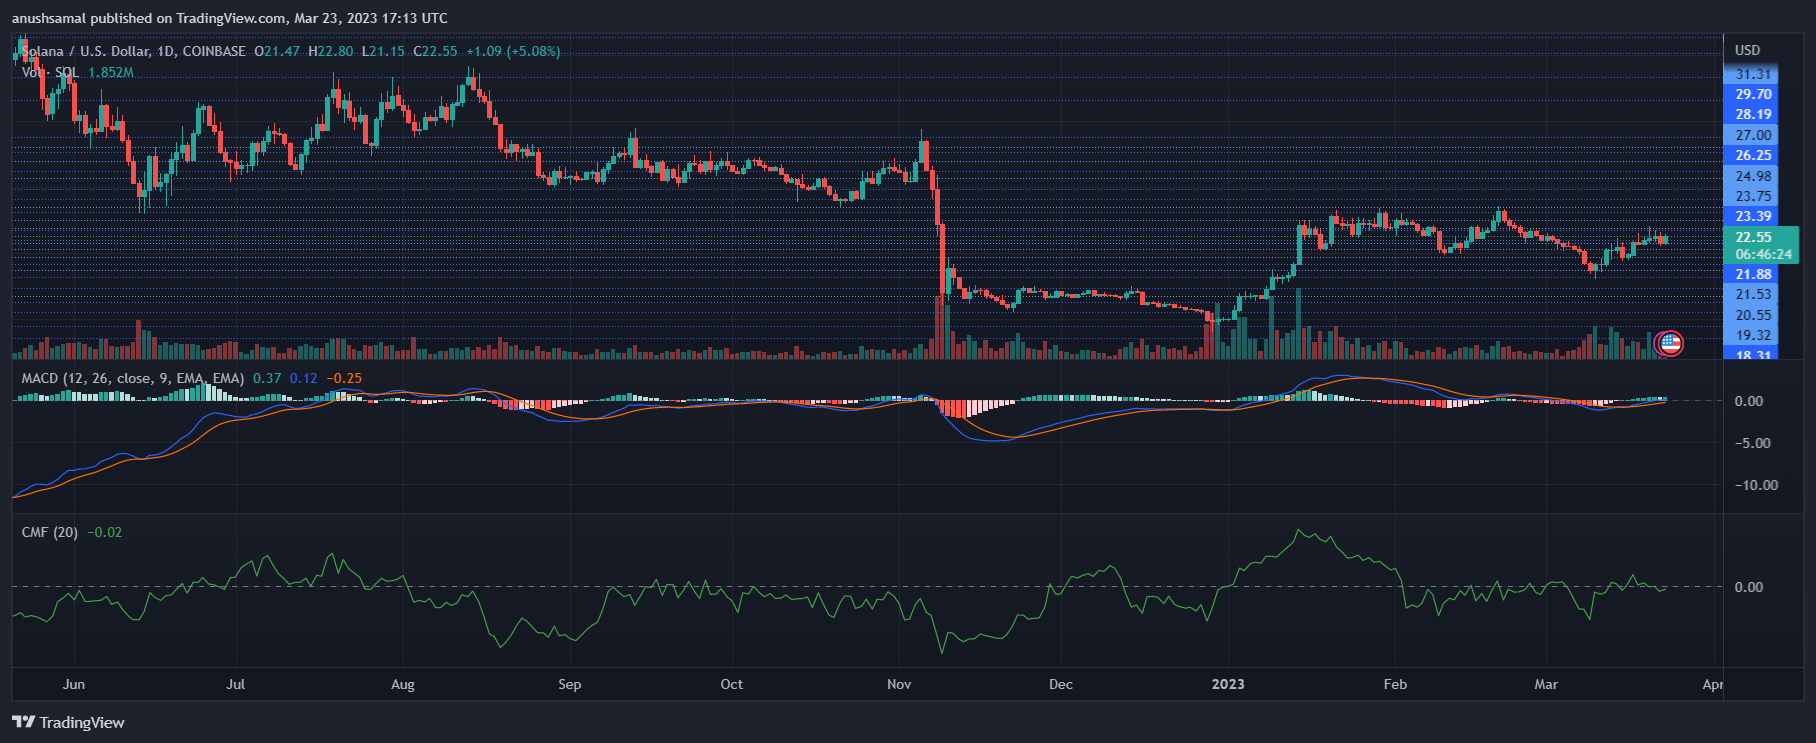
The Moving Average Convergence Divergence depicts the price momentum, which turned positive. The green histograms were related to buy signals for the altcoin. Buyers’ interest also grew as SOL remained bullish in the past few days.
This usually means that there could be an upward increase in price over the next trading session. The Chaikin Money Flow reads the capital inflows and outflows at a given time. The indicator noted a small uptick pushing the capital inflows into the positive zone.
Source: Read Full Article


