Shiba Inu Falters But Challenges $0.00001100 Barrier

Shiba Inu (SHIB) price is bearish but fluctuating below the moving average lines.
Shiba Inu price long-term forecast: bearish
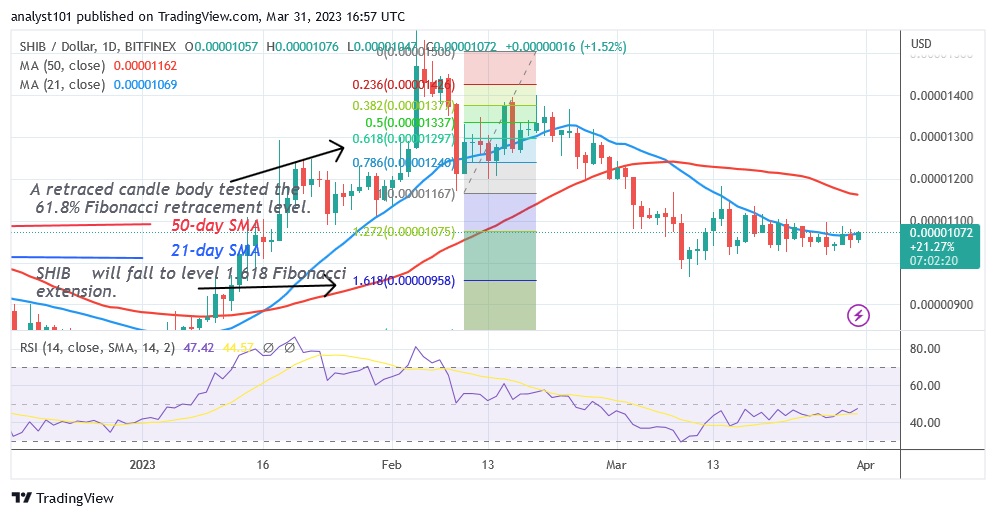
The current downtrend has slowed since March 9. Over the past three weeks, the cryptocurrency has fluctuated back and forth between the 21-day line SMA and the current support level of $0.00000985. At the time of writing, the altcoin is trading at $0.00001072. The 21-day line SMA has been providing resistance to the upward movement of the price. The price indicator predicts a further downward trend. On the downside, the market will continue to fall if the bears break the current support and reach the $0.00000958 low or the 1.618 Fibonacci extension level. However, if the current support holds, it is more likely that the bulls will break through the barriers. The uptrend will resume upon a break above the moving average lines.
Analysis of the Shiba Inu indicator
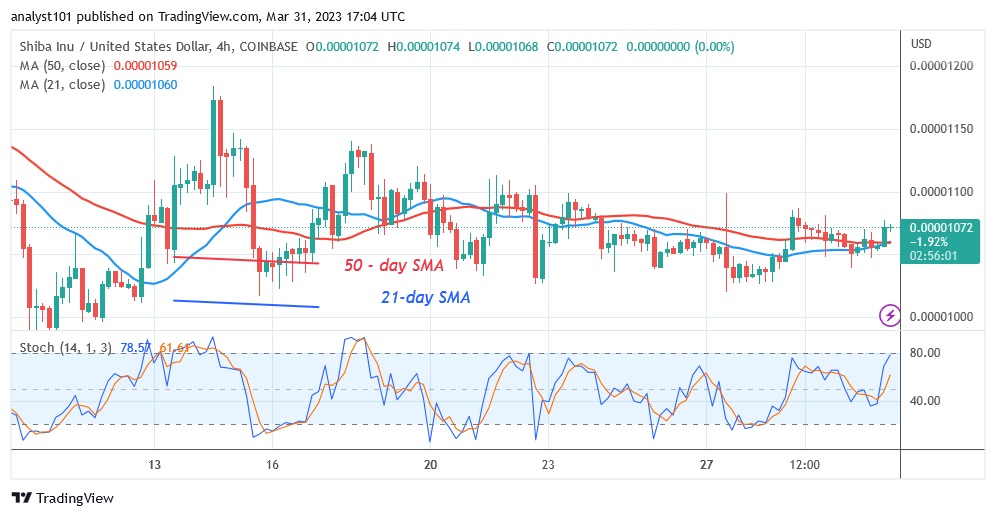
SHIB is at level 46 on the Relative Strength Index for the period 14, which means that the price of the cryptocurrency will continue to decline. The price bars are below the moving average lines, which could lead to a decline in the altcoin. The bullish momentum is not consistently above the daily stochastic level of 50.
Technical indicators
Key resistance levels: $0.00001200, $0.00001300, $0.00001400
Important support levels: $0.00001100, $0.00001000, $0.00000900
What is the next move for Shiba Inu?
Currently, SHIB is fluctuating within a narrow range between $0.00001100 and $00001020, with the cryptocurrency price testing the 21-day line SMA or resistance level. The altcoin will rise if the current downtrend comes to an end with a breakout.
Disclaimer. This analysis and forecast are the personal opinions of the author and are not a recommendation to buy or sell cryptocurrency and should not be viewed as an endorsement by CoinIdol. Readers should do their own research before investing in funds.
Source: Read Full Article


