Ripple Struggles above $0.44 as Bears Threaten to Short

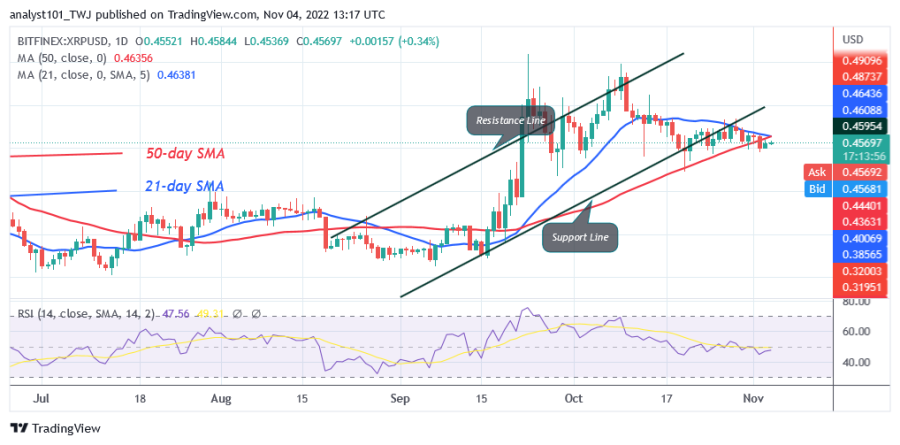
The price of Ripple (XRP) is in a tight range between moving average lines. However, sellers have broken below the 50-day line SMA, suggesting that the downtrend has resumed.
After the decline, the altcoin is setting up for an upward correction to retest the moving average lines. Selling pressure could increase if the price falls below the 50-day line SMA. If XRP turns down from the moving average, the decline will resume. Buyers have consistently maintained control over the breakout support of $0.41. However, if the support at $0.41 is broken, the sellers will gain the upper hand. If the bears break below the $0.41 support, XRP will fall to a low of $0.35. If buyers push the price above the 21-day line SMA, the market could rise to its previous high of $0.54.
Ripple indicator analysis
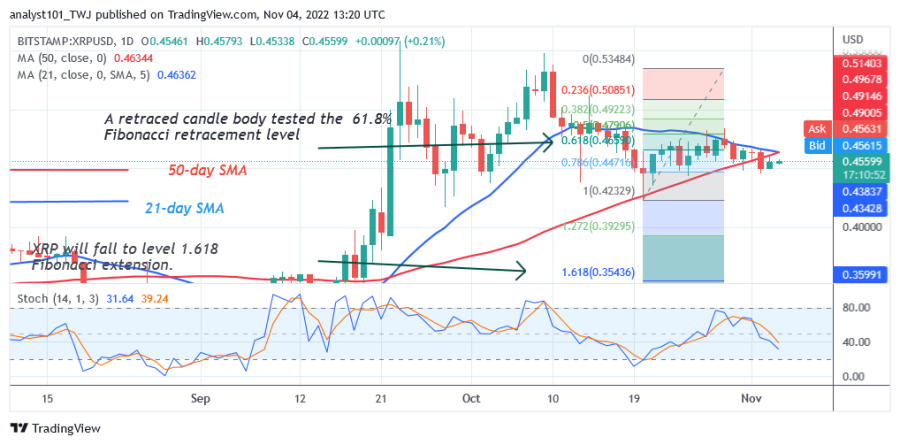
Ripple is at level 47 on the Relative Strength Index for period 14 due to the recent decline, indicating that XRP is in a downtrend and could fall further. XRP is below the 40% range of the daily stochastic. The momentum of the cryptocurrency asset is unfavorable. Despite the decline, the moving average lines are up.
Technical indicators:
Major Resistance Levels – $0.80 and $1.00
Major Support Levels – $0.40 and $0.20
What is the next move for Ripple
A potential decline in the altcoin was also indicated by the price. XRP had an upward correction during the decline on October 20, and a candlestick tested the 61.8% Fibonacci retracement level. After the correction, XRP will fall to $0.35 or the 1.618 Fibonacci extension level.
Disclaimer. This analysis and forecast are the personal opinions of the author and are not a recommendation to buy or sell cryptocurrency and should not be viewed as an endorsement by CoinIdol. Readers should do their own research before investing.
Source: Read Full Article


