Ripple Stops Above $0.44 Support As Trades Show Indifference

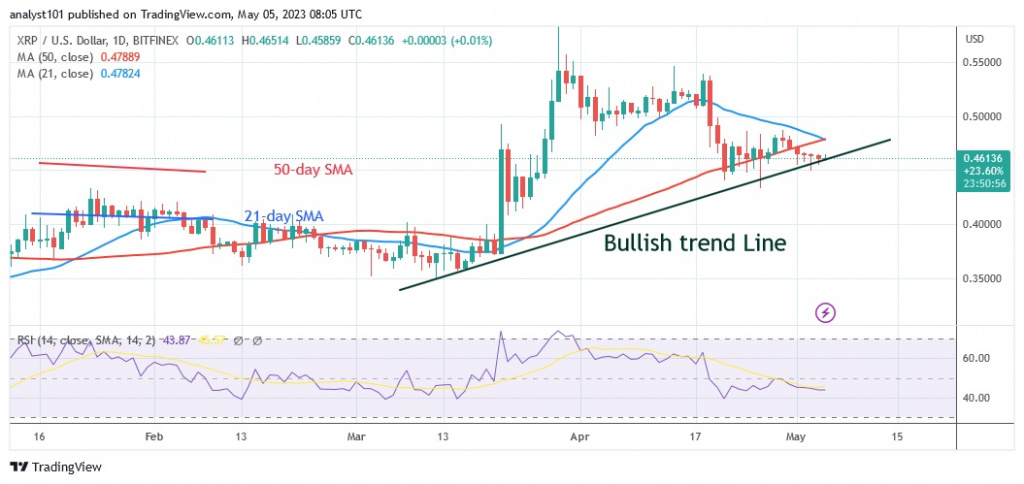
Ripple (XRP) has fallen below the moving average lines. The cryptocurrency value is bearish and approaching the current support level of $0.44.
Long-term forecast for Ripple price: bearish
The price movement has stalled above the current support level of $0.44. At the time of writing, the altcoin is trading at $0.46. The cryptocurrency is barely trading due to the presence of Doji candlesticks. The upward and downward movement of prices is speculative due to the presence of small indecisive candlesticks. The candlesticks show that both buyers and sellers are uncertain in which direction the market will move. In the next few days, Ripple is likely to move in a trading range. If the price rises above the moving average lines, XRP will resume its positive trend. The cryptocurrency asset will stay in the range above the $0.44 support, but below the $0.48 resistance.
Ripple indicator analysis
According to the Relative Strength Index for period 14, Ripple is currently trading at the 44 level. The altcoin is in a bearish trend and could fall further. As the price bars are currently below the moving average lines, the price of the cryptocurrency will fall. The daily stochastic for the altcoin is below the 80 level, and it could go down.
Technical indicators:
Key resistance levels – $0.80 and $1.00
Key support levels – $0.40 and $0.20
What is the next move for Ripple?
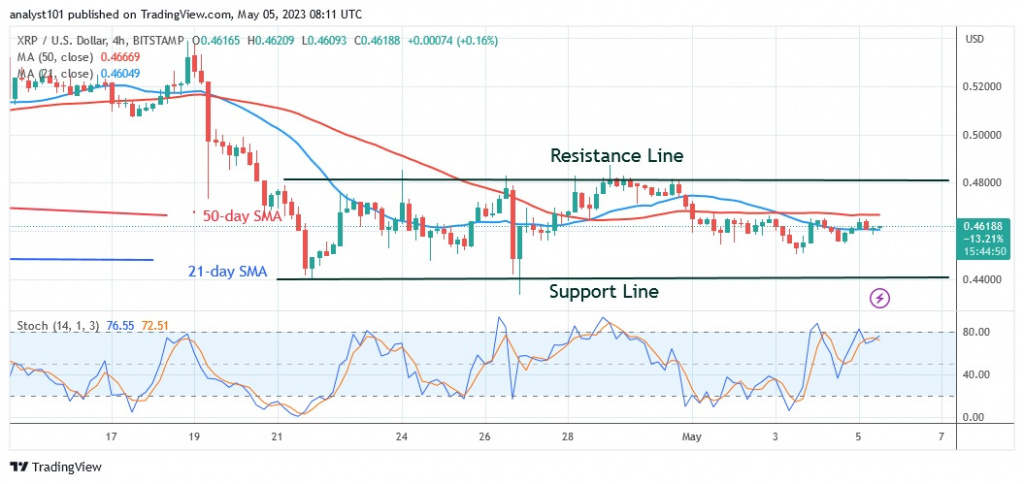
On the 4-hour chart, the price of XRP is moving sideways. Since the price decline on April 21, XRP has been fluctuating between $0.44 and $0.48. Due to the presence of Doji candlesticks, the price movement is static. If the Doji candlesticks continue to dominate the price movement, the altcoin will not show any trend.
Disclaimer. This analysis and forecast are the personal opinions of the author and are not a recommendation to buy or sell cryptocurrency and should not be viewed as an endorsement by CoinIdol. Readers should do their own research before investing
Source: Read Full Article


