Polkadot Sustains Recent Rallies, May Attempt Breakout at Recent High

On March 3, buyers attempted to push the price on the upside but DOT faced another rejection. The market declined to $32 low but the price corrected upward.
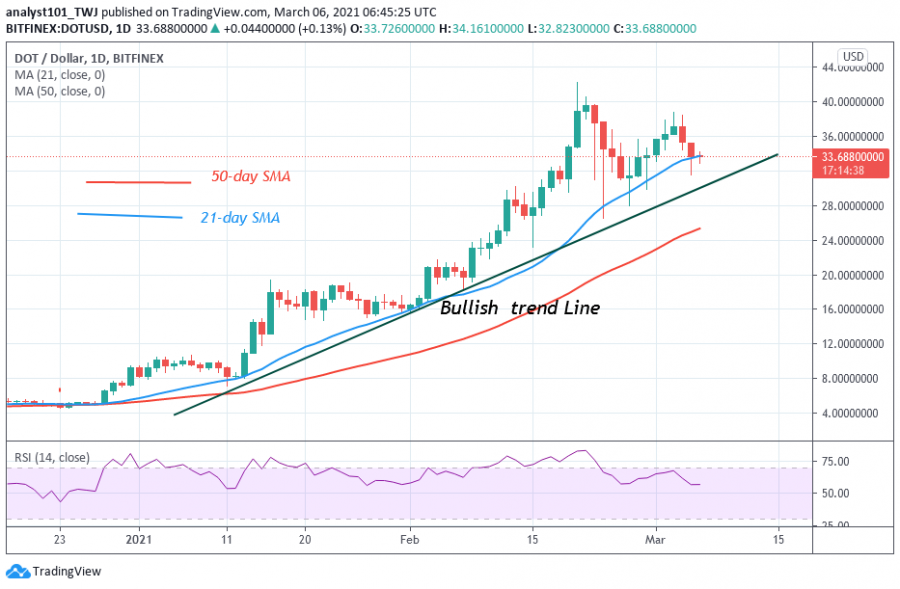
The upward correction is facing resistance at the $34 high. In the previous price actions, buyers were able to push the price to $42 high but the bulls could not sustain the uptrend.
Eventually, the price reached the overbought region of the market. In the first uptrend, the market dropped to $28 low and resumed a sideways trend. Today, the DOT price is still retracing after the resistance at $38. The retracement may find support at the $28 low. On the upside, DOT will resume an uptrend if buyers can push the price above $38 resistance. If successful, a retest at the $42 overhead resistance is likely.
Polkadot indicator analysis
DOT price is retracing toward the bullish trend line. If price falls and bounces on the trend line, the altcoin will resume an upward move. However, if price falls and breaks below the trend line; it is assumed that the prior trend is likely to reverse. DOT is at level 55 of the Relative Strength Index period 14. It indicates that the price is still in the bullish trend zone.
Technical indicators:
Major Resistance Levels – $44 and $48
Major Support Levels – $24 and $20
What is the next direction for Polkadot?
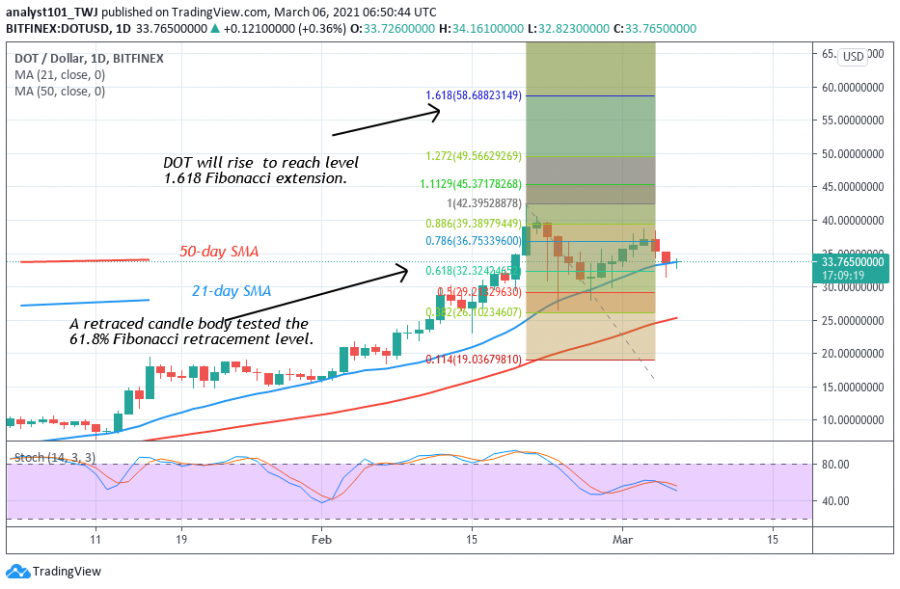
Polkadot is presently retracing but may resume an upward move. According to the Fibonacci tool, a retraced candle body tested the 61.8 % Fibonacci retracement level on February 20 uptrend. This retracement indicates that DOT will rise to level 1.618 Fibonacci extensions or a high of $58.68.
Disclaimer. This analysis and forecast are the personal opinions of the author that are not a recommendation to buy or sell cryptocurrency and should not be viewed as an endorsement by CoinIdol. Readers should do their research before investing funds.
Source: Read Full Article


