Polkadot Rebounds as It Dares the Resistance at $6.83

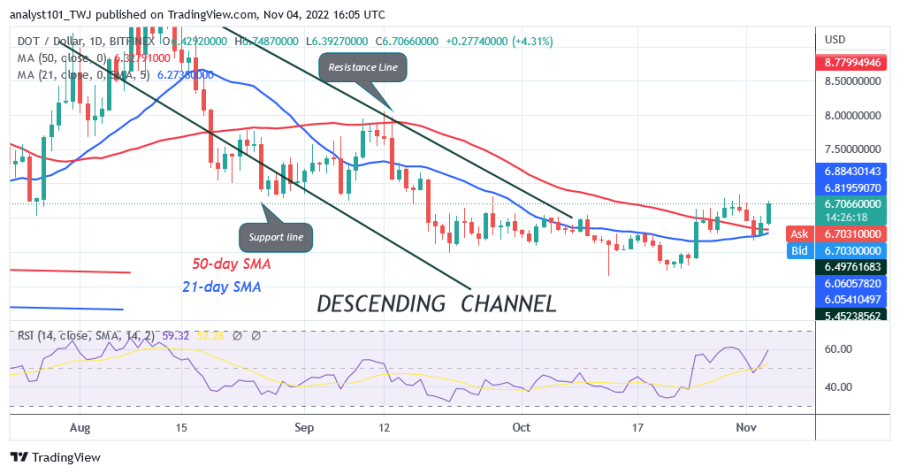
Polkadot (DOT) trades above the moving average lines and recovers to reach the previous highs. The bullish rise in the previous price action was rejected at the high of $6.83.
Today’s price action could face similar resistance. However, a price reversal could overcome the initial resistance at $6.83. The uptrend will continue to the high of $8.00. On the downside, selling pressure will resume if the price falls below the moving average lines. Thus, DOT would fall back to its previous low at the $5.73 and $5.65 levels. Beyond that, the uptrend will continue if the altcoin declines and holds above the moving average line.
Polkadot indicator analysis
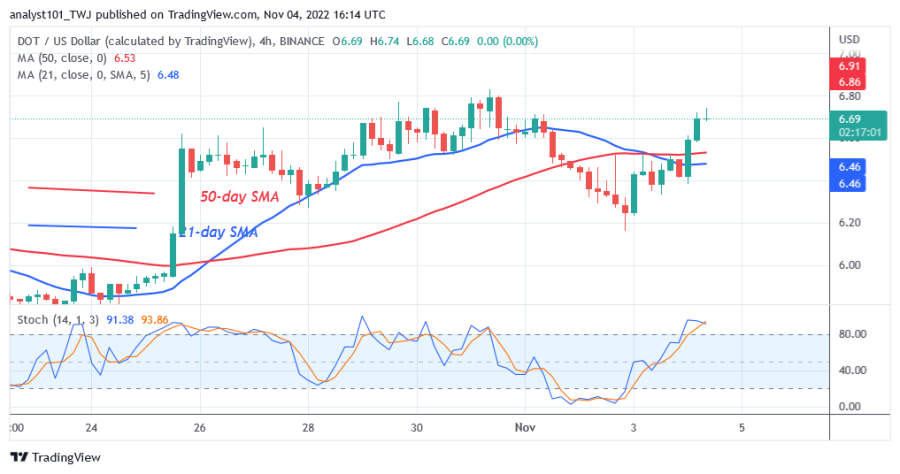
The price of DOT is at the level 58 of the Relative Strength Index for the period 14. The altcoin is in a rally and can rise even further. The cryptocurrency can rise once again if the price bars are above the moving average lines. A decline is indicated by the downward trend of the moving average lines. The altcoin price is currently above the 80% area of the daily stochastic. The current uptrend has run its course.
Technical indicators:
Major Resistance Levels – $10 and $12
Major Support Levels – $6 and $4
What is the next direction for Polkadot?
Below the $6.85 barrier, the coin is moving sideways. Buyers have been desperately trying to surpass the recent high since October 25. Since the cryptocurrency is overbought, any move higher will be resisted.
Disclaimer. This analysis and forecast are the personal opinions of the author and are not a recommendation to buy or sell cryptocurrency and should not be viewed as an endorsement by CoinIdol. Readers should do their research before investing in funds.
Source: Read Full Article


