Polkadot Fluctuates Between $32 and $38 as Buyers Regroup for a Rebound

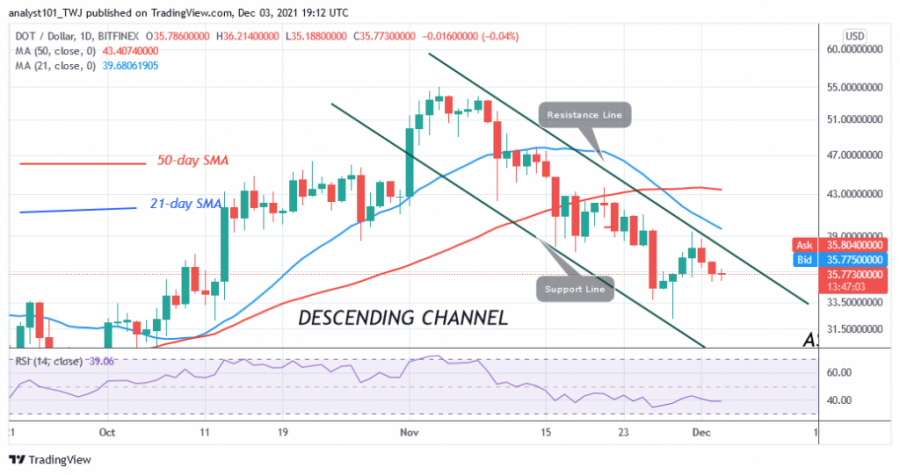
Polkadot (DOT) price is below the moving averages, falling to the low of $33. Support at $33 has held as bulls have bought the dips. DOT price is recovering from the current support and the altcoin is rising to the high of $38.
The upside correction was staved off as the market came under renewed selling pressure. Polkadot would have been in the bullish trend zone had buyers pushed the altcoin above the high of $44. However, the cryptocurrency risks further downside as it faces a rejection of the recent high. In short, the uptrend will continue if the price breaks above the $38 high. However, the selling pressure will continue if the bears break the support at $32.
Polkadot indicator analysis
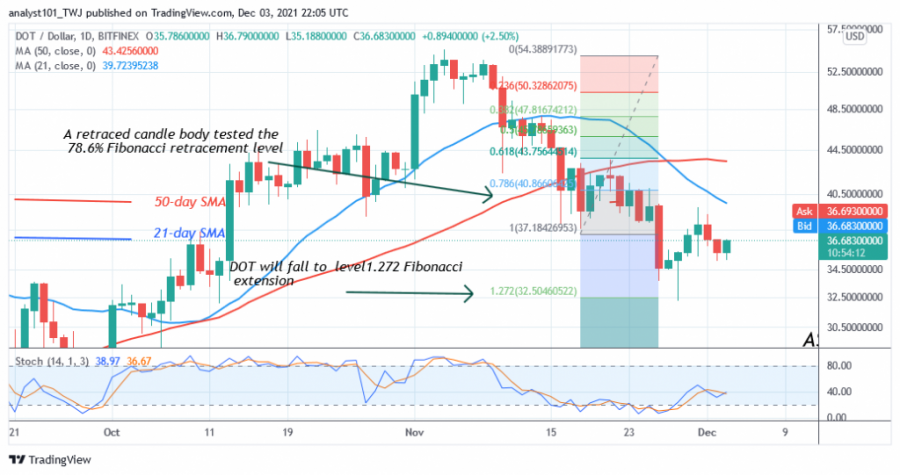
DOT price is at level 41 of the Relative Strength Index for period 14. The altcoin is trading in the downtrend zone and is vulnerable to a decline. The price bars of the cryptocurrency are below the moving average, which is the main factor for selling pressure. Meanwhile, the crypto is above the 30% area of the daily stochastic, which indicates a bullish momentum.
Technical indicators:
Major Resistance Levels – $52 and $56
Major Support Levels – $28 and $24
What is the next direction for Polkadot?
DOT/USD is still in a downward correction as the price fluctuates between $32 and $38. The current downtrend has reached bearish exhaustion as the altcoin has reached the low of $32. Meanwhile, the downtrend from November 18 has seen a retraced candlestick testing the 78.6% Fibonacci retracement level. The retracement suggests that the price of DOT will fall but reverse at the 1.272 Fibonacci extension level, or $32.50.
Disclaimer. This analysis and forecast are the personal opinions of the author and are not a recommendation to buy or sell cryptocurrency and should not be viewed as an endorsement by CoinIdol. Readers should do their research before investing funds.
Source: Read Full Article


