Litecoin Persists At The $92 High And Prepares For A Sideways Trend

Litecoin (LTC) is currently deviating below the moving average lines after the price encountered resistance at $96.
Long-term forecast for Litecoin price: bullish
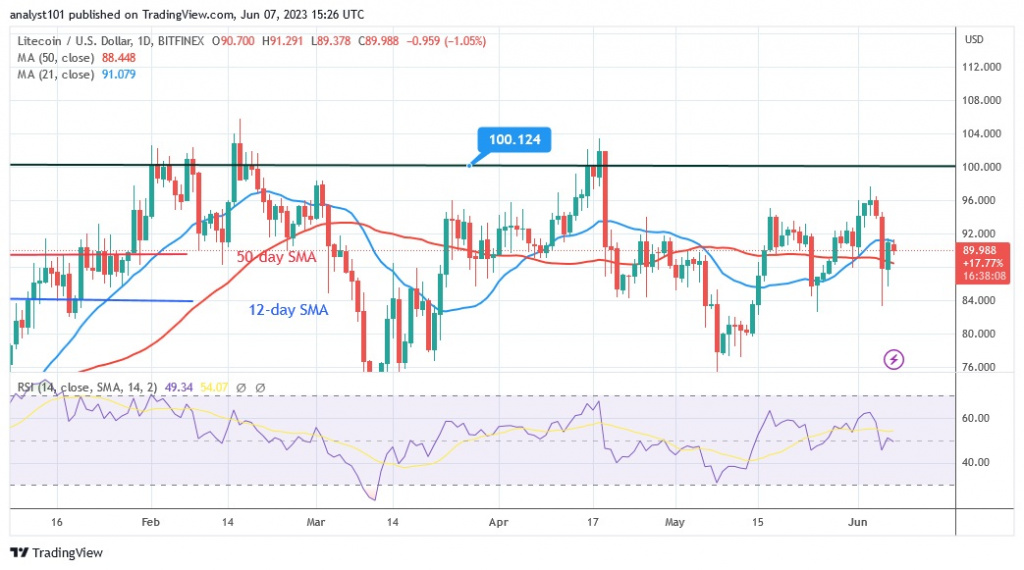
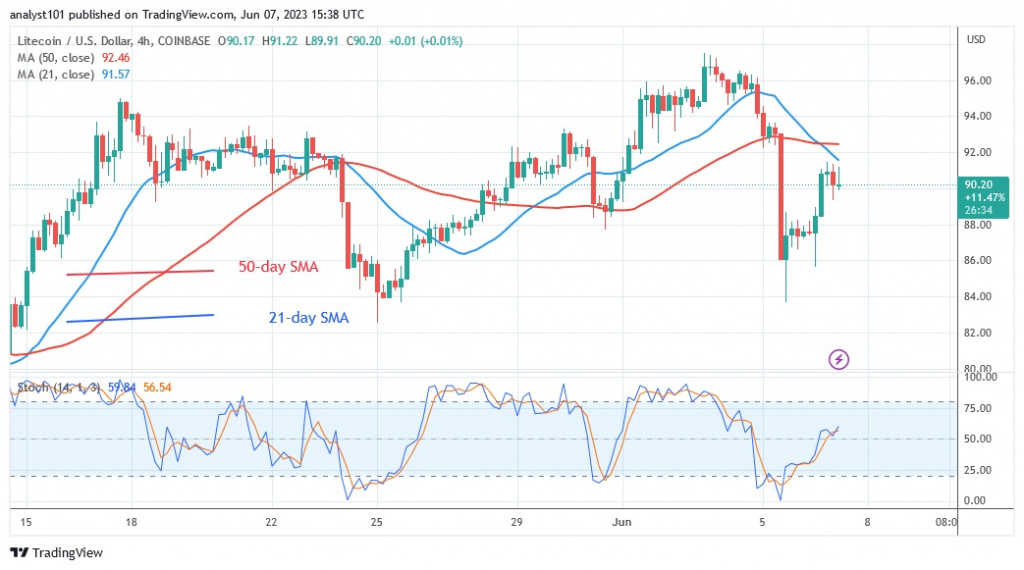
The market is overbought near the recent high. The cryptocurrency asset has been trading in an overbought zone since May 17. After reaching a high of $97, the altcoin was rejected. After a recent decline, Litecoin is currently trading at $90.31. Buyers tried to regain the previous high after the recent downturn, but the price remained at the high of $92 or the 21-day line SMA. The cryptocurrency price is currently trading between the moving average lines, which could lead it to resume its trend of fluctuation. However, if the LTC price falls below the moving average lines, Litecoin will drop to its low of $84 or $80.
Litecoin indicator analysis
According to the Relative Strength Index for the 14 period, Litecoin is at level 49. The altcoin has now reached the equilibrium price level as a result of the retracement. In other words, it is said that supply and demand have reached equilibrium. Since the price bars are between the moving average lines, the altcoin will move in a range. On the daily stochastics, Litecoin is in a positive trend above level 50. At the recent high, the upward momentum has slowed down significantly.
Technical Indicators
Resistance levels: $140, $180, $220
Support levels: $100, $60, $20
What is the next step for Litecoin?
The current price of Litecoin is indicated by the moving average lines. The cryptocurrency will be forced to go sideways if it remains trapped between the moving average lines. The cryptocurrency will move once the moving average lines are broken.
Disclaimer. This analysis and forecast are the personal opinions of the author and are not a recommendation to buy or sell cryptocurrency and should not be viewed as an endorsement by CoinIdol. Readers should do their own research before investing in funds.
Source: Read Full Article


