Litecoin is In a Tight Range as Sellers and Buyers are Indecisive

The price of Litecoin (LTC) continues to be in a downward correction.
Litecoin Price Long Term Forecast: Fluctuation Range
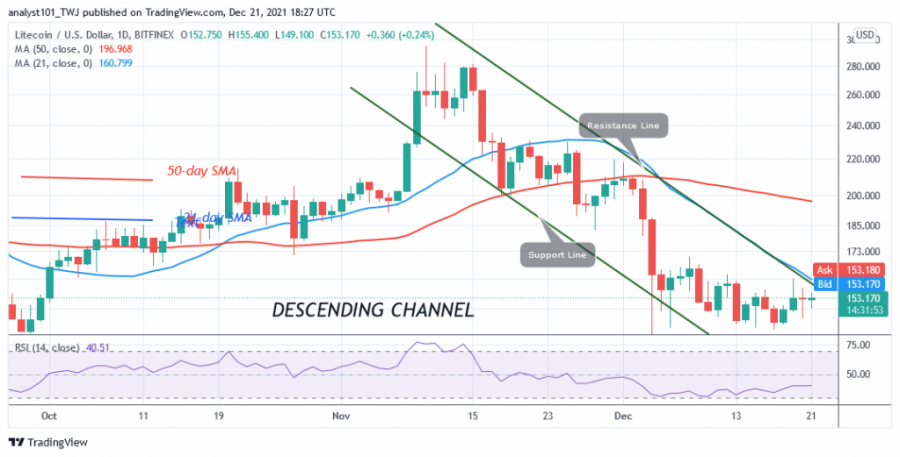
There has been no change in price movement since December 4. LTC/USD is fluctuating between $142 and $160, and support at $142 has held since August 8. It is possible that the current support will hold.
In the past month, buyers and sellers have failed to seize the price movement. Price action has been range bound. On the upside, buyers need to overcome resistance at $160 and $200 to resume the uptrend. On the downside, the bears have failed to break through support at $142, which has held since August. There is a bias for a possible upside move in the cryptocurrency.
Litecoin Indicators Analysis
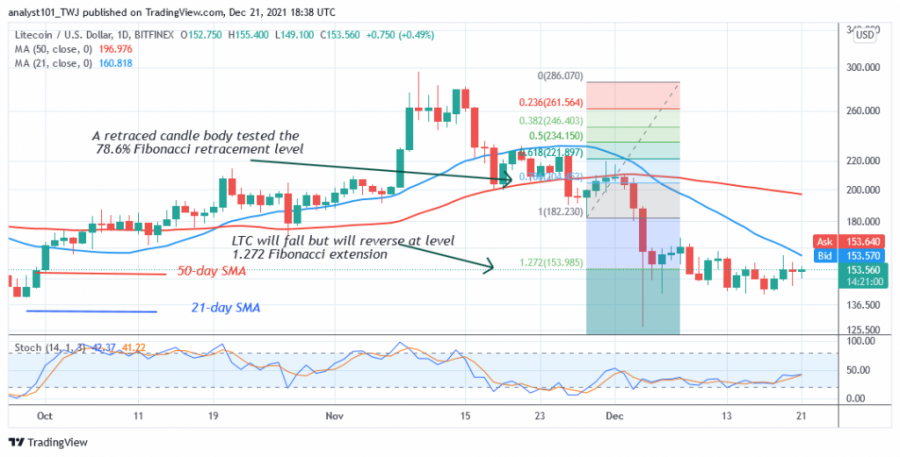
Litecoin is at level 41 of the Relative Strength Index for the period 14. LTC is trading in the bearish trend zone. The market participants have yet to break the rangebound levels. Therefore, the current fluctuation will continue. Litecoin is above the 25% range of the daily stochastic. Stochastic bands are running horizontally above the 25% range of the price indicator. There are no signs of upward price movement.
Technical Indicators
Resistance levels: $240, $280, $320
Support levels: $200, $160, $120
What is the next move for Litecoin?
Litecoin is fluctuating at the bottom of the chart. Price action is characterized by doji candlesticks (small candles). However, the analysis of the Fibonacci tool has not changed. Meanwhile, on November 28, a candlestick tested the 78.6% Fibonacci retracement level. The retracement suggests that the LTC price will fall to the 1,272 Fibonacci extension level or $153.76.
Disclaimer. This analysis and forecast are the personal opinions of the author are not a recommendation to buy or sell cryptocurrency and should not be viewed as an endorsement by CoinIdol. Readers should do their own research before investing funds.
Source: Read Full Article


