Ethereum In Downward Correction after Impressive Rally to $2,544 High

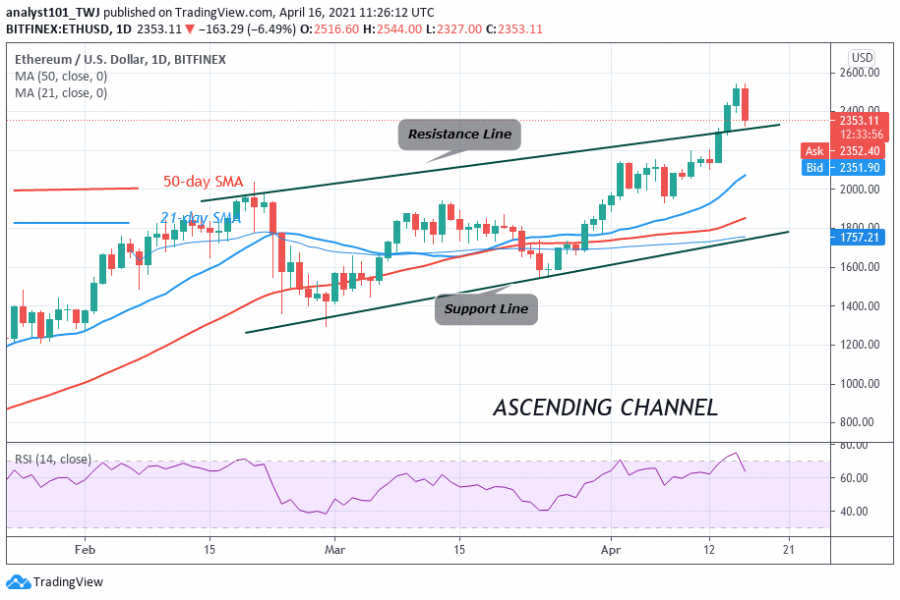
Interestingly, as expected, Ethereum bulls broke the $2,200 resistance on April 13, as price rallied to the targeted price of $2,500.
It took buyers three days of downward correction below the $2,200 resistance before it was broken. The breakout propelled price to rally on the upside. Although, the bulls do not have an easy ride as it faces resistance on the upside. For instance, buyers faced resistances at $2,400 and $2,450 price levels which were overcome.
Nevertheless, Ethereum is facing a major resistance at the targeted price level. On April 15, buyers push Ether to a new peak price of $2,544 high. This resulted in a bearish consequence. The biggest altcoin is falling because Ether price has reached the overbought region of the market. Presently, the altcoin is trading at $2,371 at the time of writing. However, selling pressure may extend to $2,200 low.
Ethereum indicator analysis
Ether has fallen to level 64 of the Relative Strength index period 14. The altcoin was earlier in the overbought region. It is in the uptrend zone and capable of rising. ETH price is falling towards the resistance line of the ascending channel. If price breaks below it, the selling pressure will resume. The uptrend will commence if price finds support above the resistance line.
Technical indicators:
Major Resistance Levels – $2,500 and $2,700
Major Support Levels – $1.500 and $1,300
What is the next direction for Ethereum?
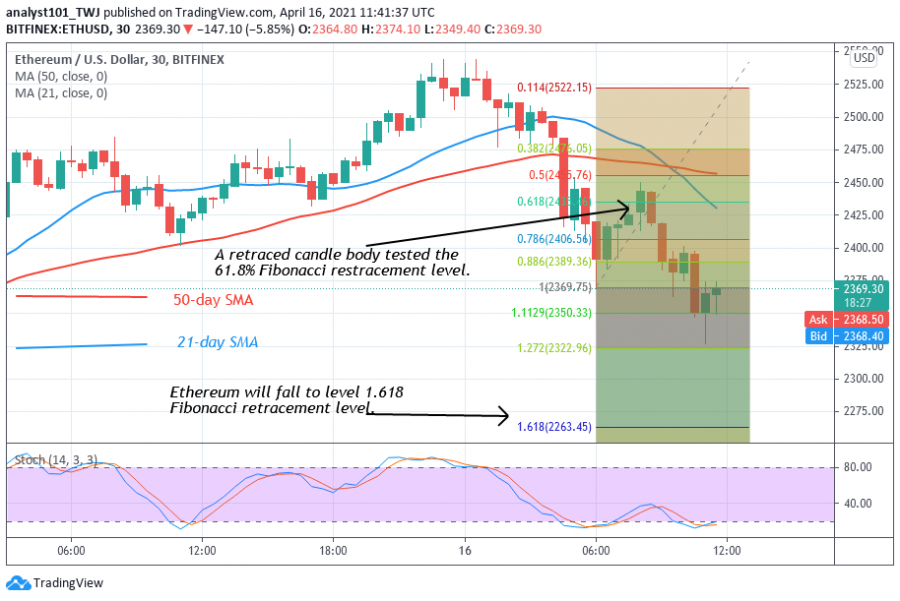
The biggest altcoin is on a downward move. Meanwhile, on April 16 downtrend; a retraced candle body tested the 61.8% Fibonacci retracement level. This retracement gives the impression that Ether will fall to level 1.618 Fibonacci extension or the low of $2,263.43.
Disclaimer. This analysis and forecast are the personal opinions of the author that are not a recommendation to buy or sell cryptocurrency and should not be viewed as an endorsement by CoinIdol. Readers should do their research before investing funds.
Source: Read Full Article


