Charted: Ripple (XRP) Eyes Fresh Rally To $0.35, Dips Remain Supported

Ripple started a strong recovery wave above the $0.3000 and $0.3100 levels against the US Dollar. XRP price is currently correcting gains from $0.3700, but dips remain limited.
- Ripple rallied above the $0.3200 and $0.3500 resistance levels against the US dollar.
- The price tested the $0.3700 zone before correcting lower, but it settled above the 100 simple moving average (4-hours).
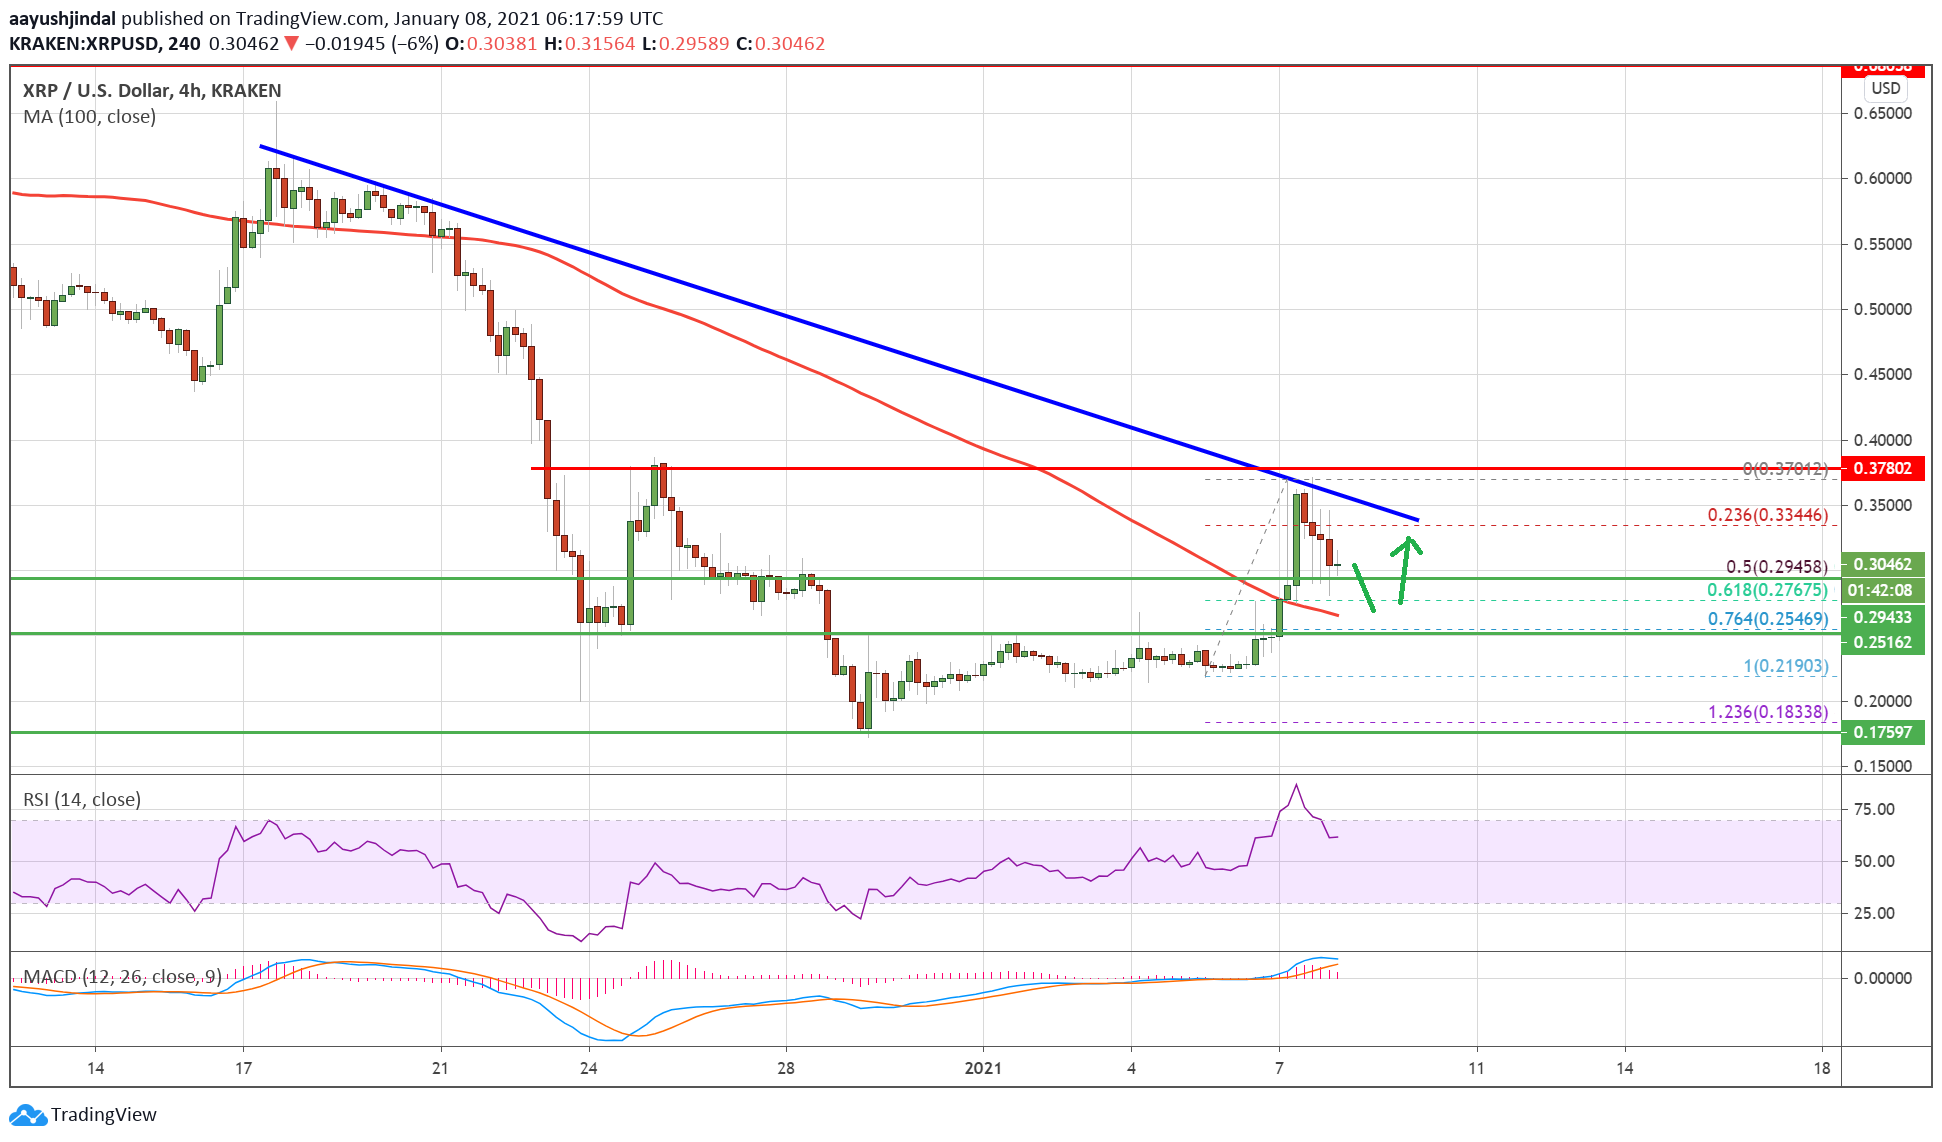
- There is a major bearish trend line forming with resistance near $0.3480 on the 4-hours chart of the XRP/USD pair (data source from Kraken).
- The pair is holding a key support near the $0.3000 and $0.2800 levels.
Ripple’s XRP Price is Holding Gains
In the past two days, ripple’s XRP price saw a sharp increase above the $0.2500 resistance level. The bulls gained strength, resulting in a sharp upward move above the $0.3000 barrier.
The price even surged above the $0.3200 level and settled above the 100 simple moving average (4-hours). The price nuked the $0.3500 level before the bears took a stand near the $0.3700 zone. There were two attempts by the bulls to gain momentum above $0.3700, but they failed.
A swing high was formed near $0.3700 before the price started a downside correction (similar to bitcoin). The price traded below the $0.3500 level. There was also a break below the 23.6% Fib retracement level of the upward wave from the $0.2190 swing low to $0.3700 swing high.
Source: XRPUSD on TradingView.com
There is also a major bearish trend line forming with resistance near $0.3480 on the 4-hours chart of the XRP/USD pair. On the downside, the $0.3000 and $0.2950 levels are important supports.
The 50% Fib retracement level of the upward wave from the $0.2190 swing low to $0.3700 swing high is also near $0.2950. Any more losses could lead the price towards the main $0.2500 support level and the 100 simple moving average (4-hours).
More Gains in XRP?
If ripple remains stable above the $0.2950 level, there are chances of a fresh increase. An initial resistance on the upside is near the $0.3250 level.
The main resistance is now near $0.3500. A close above the $0.3500 resistance zone could pump the price towards the $0.3700 and $0.3800 levels in the near term.
Technical Indicators
4-Hours MACD – The MACD for XRP/USD is losing momentum in the bullish zone.
4-Hours RSI (Relative Strength Index) – The RSI for XRP/USD is correcting lower towards the 50 level.
Major Support Levels – $0.3000, $0.2950 and $0.2550.
Major Resistance Levels – $0.3250, $0.3450 and $0.3500.
Source: Read Full Article

