Bitcoin’s Upswing Encounters Resistance Near $29,600 High

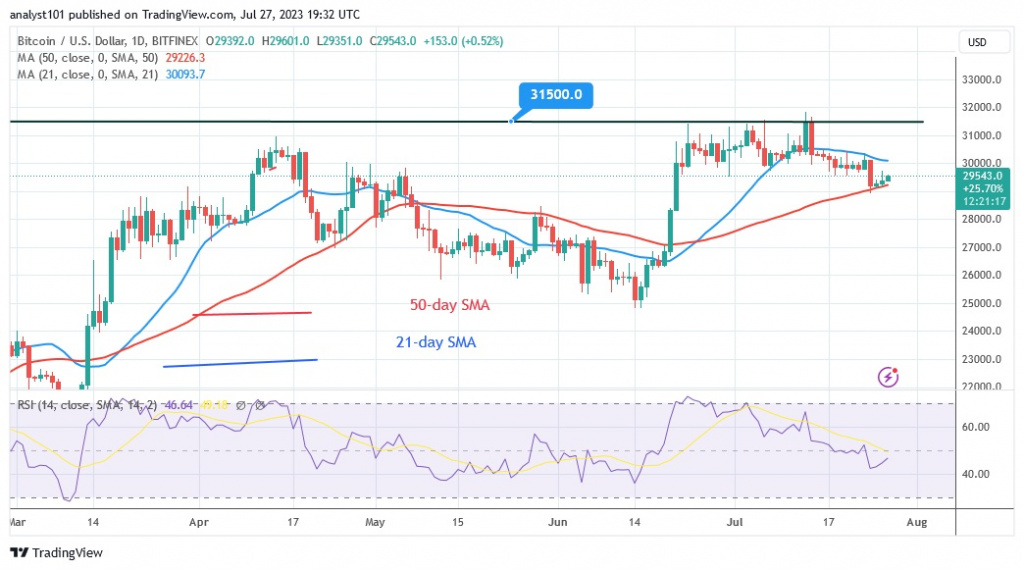
Bitcoin (BTC) price has been trapped between the moving average lines since July 14.
Bitcoin price long-term forecast: bearish
The BTC price fell dramatically on July 24 to a low of $28,924, or above the 50-day line SMA, as bulls bought the dips. Today, the largest cryptocurrency hit a high of $29,558, but it is being rejected. Similarly, buyers drove the cryptocurrency to a high of $29,678 on July 26.
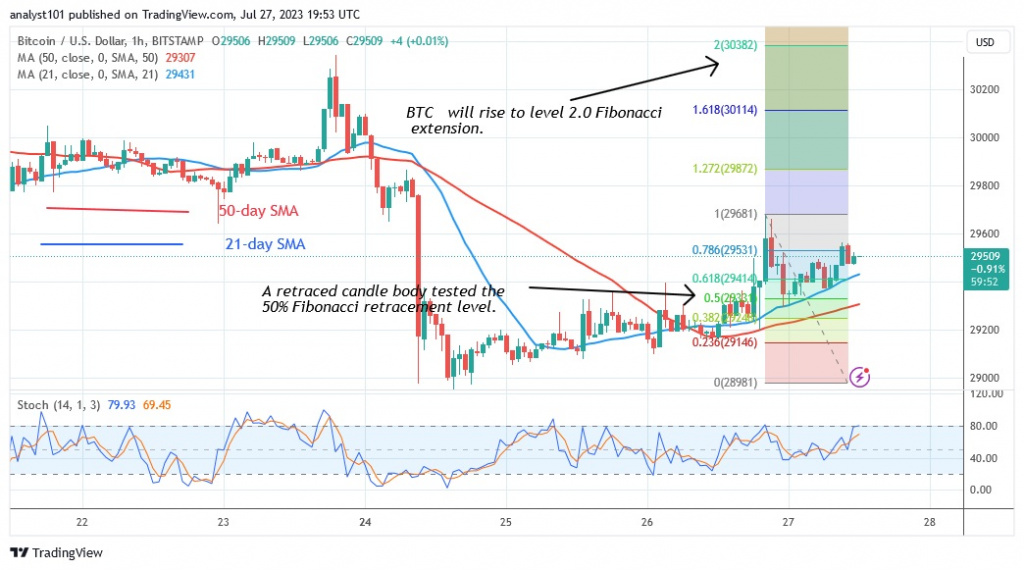
The buyers failed twice to keep the price above the $29,600 mark. If the buyers are successful, Bitcoin will rise to a high of $30,382. However, if the BTC price fails to reach the recent high, it will fall and return to a tight sideways pattern. The price of cryptocurrencies will range between $28,900 and $29,500.
Bitcoin indicator display
Bitcoin remains trapped between the moving average lines, but above the 50-day line SMA. If the price falls below the 50-day simple moving average, the downtrend resumes. For period 14, Bitcoin is in the downtrend zone at level 46 of the Relative Strength Index. The price of the cryptocurrency rises above the level 75 of the daily stochastic.
Technical Indicators:
Key resistance levels – $30,000 and $35,000
Key support levels – $20,000 and $15,000
What is the next direction for BTC/USD?
Bitcoin has resumed strong momentum on the 4-hour chart. The price indication predicts that Bitcoin could rally to the upside. A retraced candlestick has tested the 50% Fibonacci retracement level of the July 26 upswing. The retracement suggests that BTC will rise to the 2.0 Fibonacci extension level or $30,382. Meanwhile, the upswing is encountering resistance near the $29,600 high.
Disclaimer. This analysis and forecast are the personal opinions of the author and are not a recommendation to buy or sell cryptocurrency and should not be viewed as an endorsement by CoinIdol.com. Readers should do their research before investing in funds.
Source: Read Full Article


