Bitcoin Cash is in a Tight Range, Unable to Break Recent High

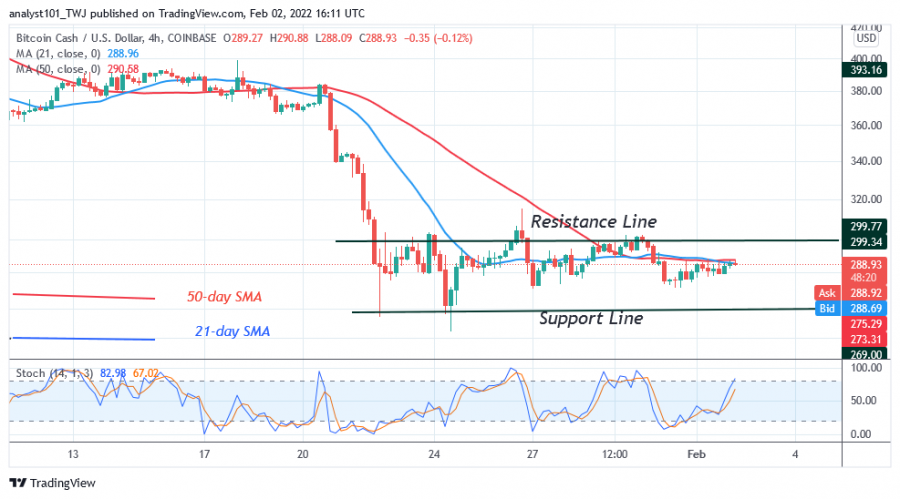
Bitcoin Cash (BCH) has started a sideways movement after falling to the low of $265. The cryptocurrency seems to be in a tight range between $269 and $300.
Buyers have made three attempts to bring the altcoin to the previous highs. The upward moves end at the $300 price level, while the altcoin falls and finds support in the middle of the price range.
If the bulls break through the resistance at $300, the market will go up to $380. In the meantime, price action is characterized by small indecisive candlesticks called doji. These are responsible for the range-bound movement. These candlesticks describe the indecision between buyers and sellers regarding the market direction. The altcoin is trading at $289 at the time of writing.
Bitcoin Cash indicator reading
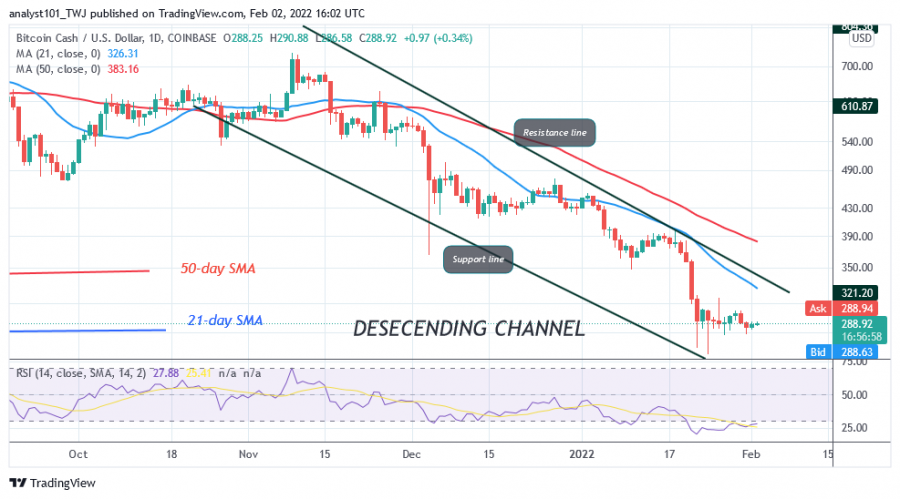
Bitcoin Cash is trading in the oversold region of the market. The Relative Strength Index for period 14 is at level 28, and buyers are still expected to emerge in the oversold region of the market. Nevertheless, BCH is above the 50% area of the daily stochastic. This indicates that the market is in a bullish momentum.
Technical Indicators
Key Resistance Zones: $800, $820, $840
Key Support Zones: $500, $480, $460
What is the next move for Bitcoin Cash?
On the 4-hour chart, Bitcoin Cash is in a trading range between $269 and $300. On the chart, the bulls tested the resistance level three times to overcome it, but were rejected. Nevertheless, the movement within the trading range will continue as long as the boundaries of the trading range remain unbroken.
Disclaimer. This analysis and forecast are the personal opinions of the author and are not a recommendation to buy or sell cryptocurrency and should not be viewed as an endorsement by Coin Idol. Readers should do their own research before investing funds.
Source: Read Full Article


