Bitcoin Cash in Sideways Move, Battles Resistance at $1,600

On May 12, Bitcoin Cash (BCH) is fluctuating between levels $1,300 and $1,600. On the downside, if the bears break below the $1,300 support, the market will further decline to a low of $1,000. Meanwhile, the altcoin is trading at $1,508.96 at the time of writing.
Bitcoin Cash price Long-term Analysis: Bullish
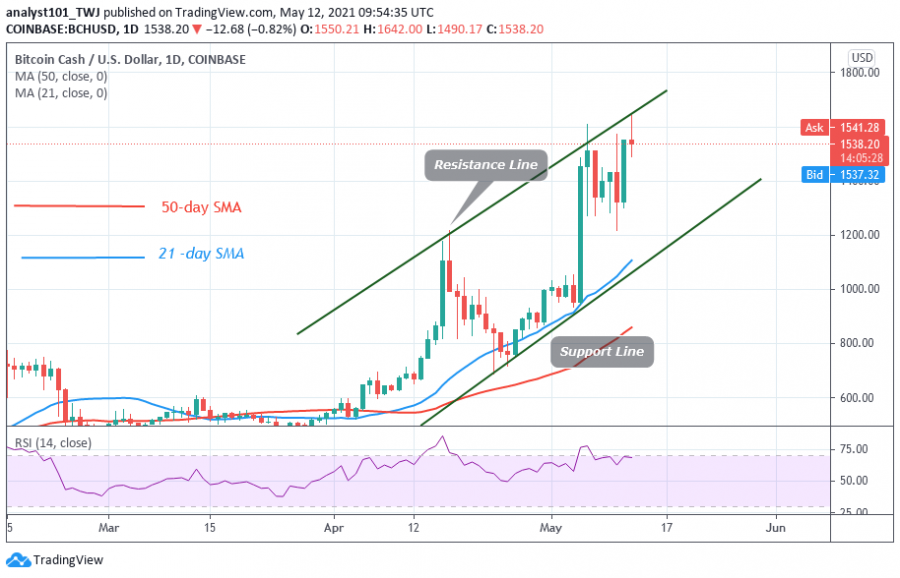
Since May 6, BCH’s price has been stalled at a $1,600 high. For the past week, Bitcoin Cash has been compelled to a sideways move as bulls fail to breach the $1,600 resistance. Buyers have retested the recent high on three occasions to resume the current uptrend but to no avail. Each time, BCH retests the recent high; the market will fall to the low of $1,300. Nonetheless, BCH/USD will rally to a new high of $2,000, if the bulls succeed in breaking the current resistance level.
Bitcoin Cash Indicator Reading
Bitcoin Cash price is above the moving averages which suggest a further upward movement of prices. BCH price is also consolidating near the resistance zone. Consolidation near a resistance zone increases the chances of a breakout. The 21-day and 50-day SMAs (moving averages) are sloping upward indicating an uptrend.
Technical indicators:
Major Resistance Levels – $1,800 and $2,000
Major Support Levels – $1,000 and $800
What Is the Next Move for Bitcoin Cash (BCH)?
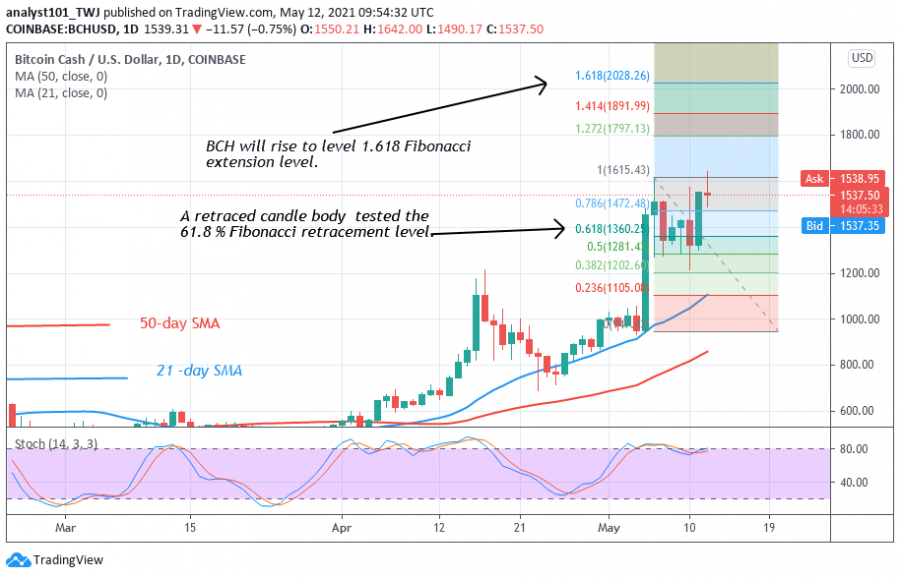
Bitcoin Cash is likely to move up once the resistance at $1,600 is breached. The Fibonacci tool has indicated a further upward movement of prices. On May 6 uptrend; a retraced candle body tested the 61.8 % Fibonacci retracement level. The retracement indicates that BCH will rise to level 1.618 Fibonacci extension.

Disclaimer. This analysis and forecast are the personal opinions of the author and not a recommendation to buy or sell cryptocurrency and should not be viewed as an endorsement by Coin Idol. Readers should do their own research before investing funds.
Source: Read Full Article

