Bitcoin Cash Holds above $510 as Bulls and Bears Contemplate Next Move

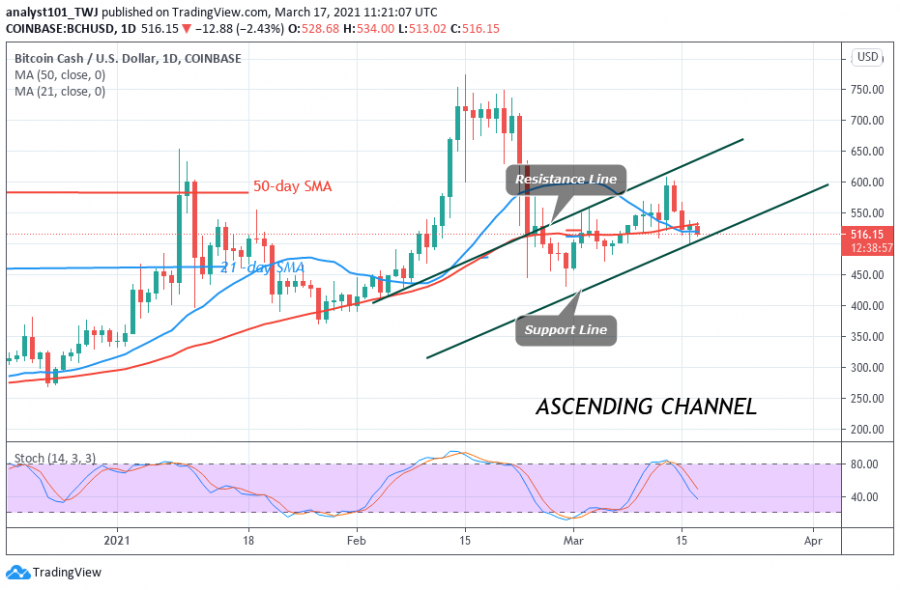
The BCH/USD has been in a sideways move for the past three days. Today, BCH price has fallen to the support above $500 and it is consolidating above it.
This has been the price action for the past three days. After the March 15 breakdown, the altcoin dropped to $514 and resumed fluctuation between $510 and $540.
The range-bound levels have not been broken since the inception of the sideways trend. On the upside, if the bulls break the $540 resistance, a retest at $600 resistance is likely. Similarly, if the bears break the $510 support, BCH will decline to a $440 low. Nonetheless, BCH will continue its range bound move if the key levels remain unbroken.
Bitcoin Cash indicator reading
The 50-day and 20-day SMAs are sloping horizontally indicating the range-bound move. The altcoin is below the 40% range of the daily stochastic. It indicates that the market is in bearish momentum. BCH price action is characterized by small body candlesticks called Doji and Spinning tops. This describes indecision between buyers and sellers.
Technical indicators:
Major Resistance Levels – $750 and $800
Major Support Levels – $450 and $400
What is the next move for Bitcoin Cash?
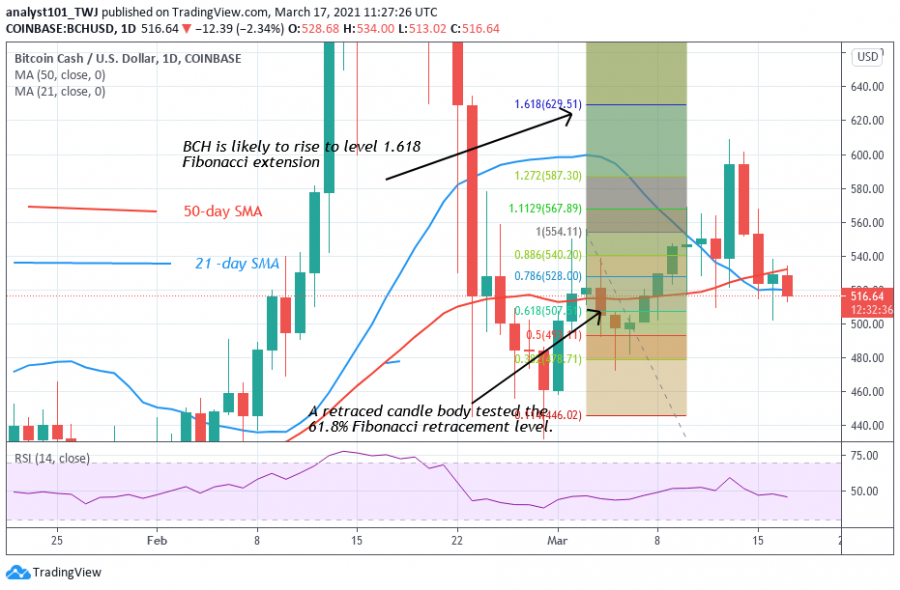
BCH/USD is trading marginally because of the indecision between buyers and sellers. As price consolidates above $500, there is the possibility of an upward move. On March 3 uptrend; a retraced candle body tested the 61.8% Fibonacci retracement level. The retracement indicates that BCH is likely to rise to level 1.618 Fibonacci extensions or the high of $629.51.
Disclaimer. This analysis and forecast are the personal opinions of the author that are not a recommendation to buy or sell cryptocurrency and should not be viewed as an endorsement by Coin Idol. Readers should do their own research before investing funds.
Source: Read Full Article


