Bitcoin Cash Holds Above $110 Support And Continues Its Sideways Trend

Bitcoin Cash (BCH) price is in a downtrend, falling to the low of $109.03. Today BCH is trading above $110 support.
Bitcoin Cash price long-term analysis: bearish
The recent decline was caused by an upward correction above the moving average lines and the subsequent rejection at the $123 price level.
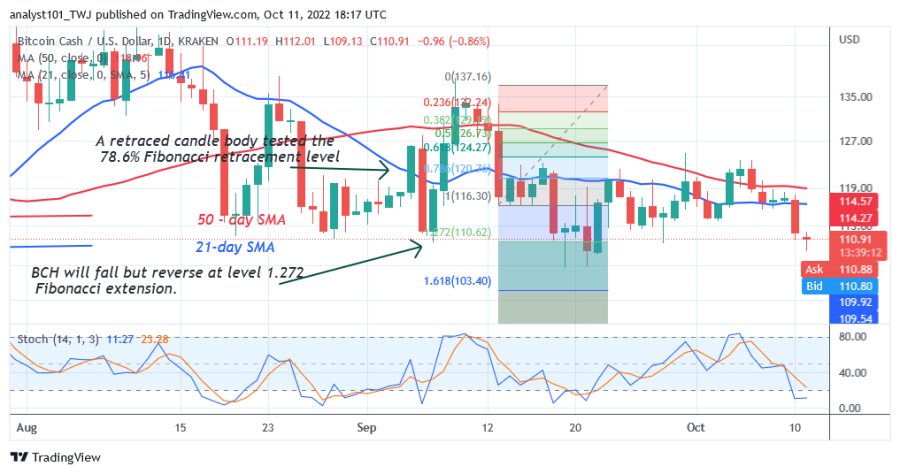
Since the September 13 price drop, the bulls have retested $120 resistance four times, but have been unable to continue the uptrend. After each retest, the cryptocurrency fell above the $110 support to start another leg of a sideways movement. Today, BCH will continue its uptrend if the current support holds. It is possible that a price rally will break above the moving average lines and regain the previous highs of $138 and $164.
Bitcoin Cash indicator display
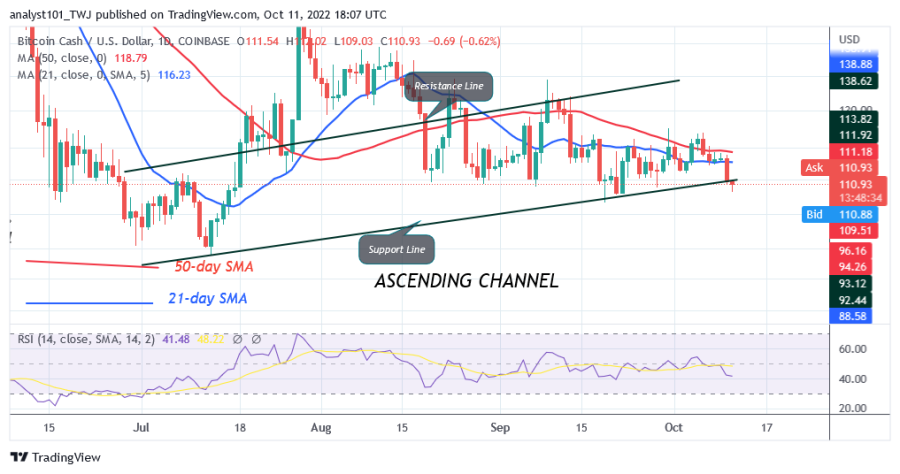
The recent decline has pushed BCH into the downtrend zone at level 41 of Relative Strength for the period 14. The altcoin is capable of falling further in the downtrend zone. The price bars are below the moving average lines, indicating a further decline. However, a further decline is unlikely as it is below the 20% range of the daily stochastic. That is, BCH is trading in the oversold area of the market.
Technical Indicators
Key resistance zones: $130 and $150
Key support zones: $120 and $100
What is the next move for Bitcoin Cash?
BCH The price of Bitcoin Cash has fallen above the current support as the cryptocurrency resumes its sideways movement. Since September 13, the altcoin has been back on the upside after retesting above the $110 support. The downtrend has reached bearish exhaustion.
Disclaimer. This analysis and forecast are the personal opinions of the author and are not a recommendation to buy or sell cryptocurrency and should not be viewed as an endorsement by Coin Idol. Readers should do their own research before investing in funds.
Source: Read Full Article


