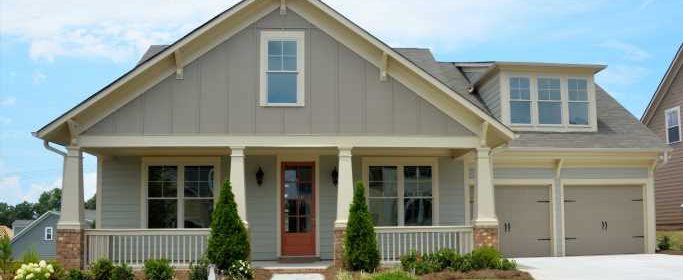
The Most At-Risk Housing Markets

One of the few sectors that thrived during the COVID-19 pandemic was real estate. Existing home sales in 2020 hit their highest level in nearly a decade and a half — and surging demand pushed real estate prices higher. The median home sale reached a multi-decade high of $278,000 in the first quarter of 2021, up 17.7% from a year earlier, according to ATTOM Data Solutions.
Despite a strong real estate market, there are still many counties where the housing market is at increased risk from the impact of the pandemic, directly or indirectly.
These areas have higher than average foreclosure rates and higher than average shares of homes with underwater mortgages — meaning the value of outstanding loans exceeds the total value of the property. Some of these markets are also far less affordable than average with high homeownership costs relative to local incomes.
Based on an index of these three measures — foreclosure rates, share of underwater mortgages, and affordability — at the county level, 24/7 Wall St. identified the most at-risk housing markets. All data in this story was compiled in the first-quarter 2021 Special Coronavirus Report from ATTOM Data Solutions, a real estate and property data company.
Many of the counties on this list are located in eastern United States, spanning Florida up through the mid-Atlantic and New England. The pandemic has taken a greater than average economic and public health toll in some of these counties. This is the county in each state with the most deaths from COVID-19.
“The pandemic still looms large and may pose a threat to the progress made so far, and by extension could affect home sales and prices,” said Todd Teta, chief product officer with ATTOM in a press release. Indeed, the housing market is thriving, but many American homeowners remain vulnerable.
Click here to see the most at-risk housing markets
To determine the most susceptible housing markets, 24/7 Wall St. reviewed data from ATTOM Data Solutions’ Q1 2021 Special Coronavirus Report on the susceptibility of county-level housing markets to risks arising from the coronavirus pandemic. Counties were ranked based on an index that consists of the percentage of residential properties with a foreclosure filing during the first quarter of 2021, the percentage of average local wages needed to afford the major expenses of owning a median-priced home in the first quarter of 2021, and the percentage of properties with outstanding mortgage balances that exceeded their estimated market values in the fourth quarter of 2020, that is underwater mortgages. All index components came from ATTOM Data Solutions and were weighted equally. Supplemental data on unemployment and labor force came from the Bureau of Labor Statistics and are not seasonally adjusted.
Source: Read Full Article
