Bitcoin Ends 2020 On a High Note in Terms of Active BTC Addresses
Summary:
- December 30th and 31st saw the highest number of active Bitcoin addresses since January 2018
- Bitcoin has since posted a new all-time high of $29,900
- $30k might provide volatility as pointed out earlier by Timothy Peterson
- The path of least resistance is up for Bitcoin although it is clearly overbought
The King of Crypto, aka Bitcoin (BTC), closed 2020 on a high note in terms of active addresses. According to data from the team at Santiment, December 30th and 31st saw the largest single days of active Bitcoin addresses since January 10th, 2018. The team at Santiment further pointed out that such network activity was a very encouraging sign for Bitcoin entering into 2021.
They shared their observation of Bitcoin via the following tweet and accompanying chart demonstrating an increment in active BTC addresses on the two days.
?? To end 2020, #Bitcoin had the two largest single days of active addresses (1,215,762 on Dec. 30 & 1,203,679 on Dec. 31) since January 10, 2018. It goes without saying that this is a very encouraging sign for $BTC longs starting off 2021. https://t.co/BUd89Y5jRK pic.twitter.com/LRfHV8z3ix
— Santiment (@santimentfeed) January 1, 2021
Bitcoin Sets a New All-time High of $29,900
At the time of writing, Bitcoin is trading at $29,700 after posting a new all-time high of $29,900 earlier today. The latter value is only $100 shy of the highly anticipated $30k price ceiling.
Bitcoin testing $30k will prove that it is indeed the best store of value and a hedge against inflation. However, such an achievement brings with it the possibility of volatility for Bitcoin.
$30k Might Be a Volatile Area for Bitcoin
Timothy Peterson of Cane Island Alternative Advisors had pointed out last week that the $30k price area is a possible ‘red alert’ zone for Bitcoin. According to Mr. Peterson, Bitcoin breaking this level would increase the chances of a future large crash similar to those experienced in 2012, 2014 and 2018.
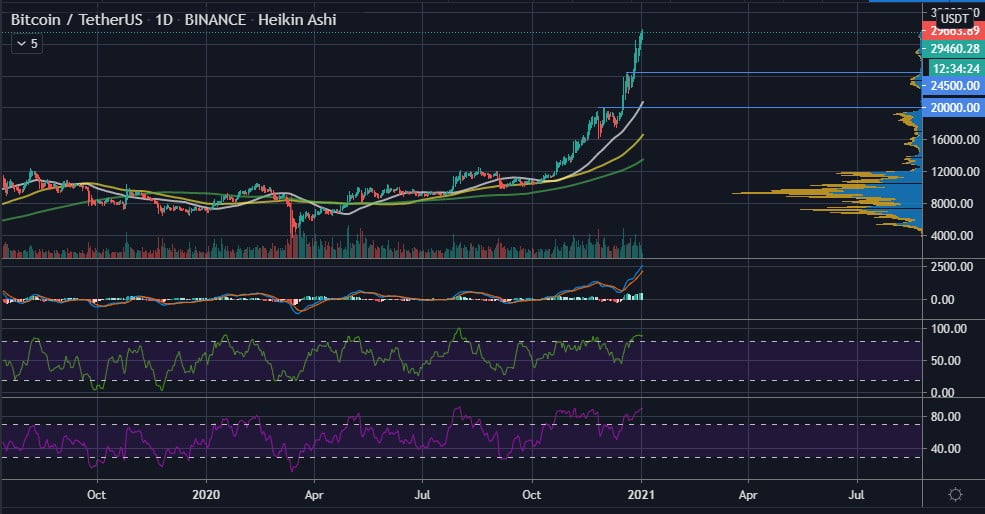
A quick glance at the daily BTC/USDT chart below, reveals that the $24,500 and $20k price areas provide adequate support for Bitcoin on a macro level.
Also from the BTC/USDT chart, the following can be observed.
- Trade volume is in the green although exhibiting signs of weakness
- The daily MACD is in overbought territory with its histograms also confirming some level of buying weakness
- The daily MFI and RSI are also in overbought territory at a value of 88 and 90 respectively
Summing up the brief technical analysis, Bitcoin is inches away from achieving the highly anticipated $30k all-time high. However, the daily Bitcoin chart hints that the journey to $30k and above might involve a pullback along the way.
As with all analyses of Bitcoin, traders and investors are advised to use adequate stop losses when going long. Furthermore, the use of low leverage is advised to protect trading capital from liquidations.
Source: Read Full Article

